Data science is now officially cooler than the weather when I last posted.
One of my favorite bosses has pointed out on multiple occasions how he is very open to ideas in general or ideas of change, granted they are backed by data. It’s a cool philosophy to be a part of. Who doesn’t appreciate an open-door policy? And who can’t respect the simple ask to have a little homework done before wandering in.
Using data to make decisions isn’t particularly new. Alexander the Great didn’t order esteemed general Parmerio to be killed for no reason. He did it because he had information that Parmerio was a traitor and was trying to assassinate him. That’s making decisions with data. Alexander the Great was arguably a data scientist, as early as 330 B.C.!
Was Alexander the Great’s information from a reliable source? We’ll never know. But his decision was certainly made based on data.
What’s modern about it is that we now have transactional data that collect information data as fast as I process my own simultaneous, over-analyzing, brain-neuron thoughts. Isn’t that crazy!! Target, for example, obtains a small fortune of data every hour. Amazon. Etc. They have a lot of things going on, own a lot of random things that a lot of people/businesses use and interact with and demonstrate useful behaviors on, allowing them to store those things to utilize for revenues. Amazon is truly amazing I mean Bezos was just like whoops, I own all of you now. Target is impressive because they weren’t already online and super diverse like Amazon but managed to recognize the benefit of coordinating their empire with the concept of streaming data. Don’t hate the player, hate the game!
does Facebook still exist in the year 3000?
If you’ve never really understood statistics but you have watched Ozark, Marty Byrd gives you everything you need to know about it in the third season: the law of large numbers. Individually we are unpredictable but in groups, there are patterns, and these patterns, we can leverage, just like Target and Facebook and Amazon leverage those patterns, to make an argument for or against some decision, such as whether or not we should push more ads on you in hopes that you will buy that thing you were Googling the other day. Data science!
Of course, direct revenues and profits aren’t the only things arguments are used for. If you’re Marty Byrd, you want to predict which new hire is actually an FBI agent so that a Mexican drug cartel doesn’t get pissed and come after everyone you love. If you’re a corrupt government, you may use data to make some argument for passing laws to control the masses one way or another. If you’re a bumble bee, you may use data to select which flower looks the most yummy so you can make some honey. Serve the queen.
When you think Spark, think Hadoop. When you think Hadoop, think 4 things:
Common
Hadoop Distributed File System (HDFS)
MapReduce
YARN
Hadoop Common is the collection of common utilities and libraries that support other Hadoop modules, including Java Archive (JAR) files and scripts required to start Hadoop.
HDFS essentially takes a job done by 1 worker in 10 hours and creates 10 workers and completes the job in 1 hour.
MapReduce is one of those names that’s supposed to make sense and describe what it actually is. The Map is the filtering (“map A to B”), and you might perform some calculations. Reduce then aggregates your data, likely also performing one final calculation. Whether the definition really matches its name is up for debate.
YARN came later to compliment limitations of the MapReduce algorithm and stands for Yet Another Resource Negotiator, probably because YARN happens to be a nice acronym and a word related to thread. What YARN really does is orchestrates jobs, manages packages (resolves dependencies), and implements multiple customized applications.
Hadoop was introduced around 2005 as a result of a Google Whitesheets article and the stuffed animal of Doug Cutting’s son. No one to my knowledge has questioned why Doug Cutting’s son made up the name Hadoop for his stuffed elephant, but here we are.
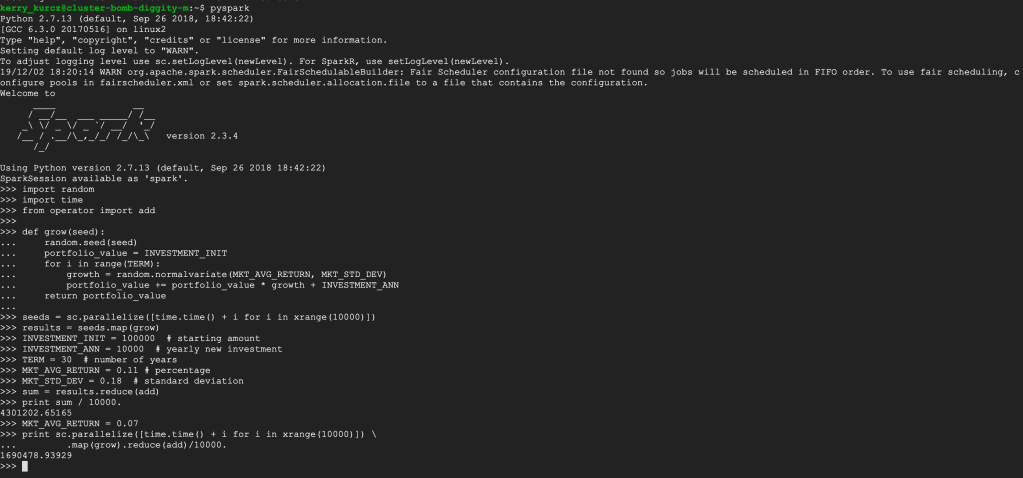
PySpark is just Spark, in Python. You can also use Scala, R, SQL.
You can set up and run pySpark locally, managing that and all its Hadoop and Java dependencies yourself, or you can do yourself justice and just use the Google Cloud Platform‘s (GCP) managed service, DataProc. DataProc also supports Hadoop, Hive, Presto (if you insist), and other things that use Spark/Hadoop clusters — even scaling those clusters — and run Spark/Hadoop jobs, supporting large datasets for querying, batch processing, streaming, and machine learning.
GCP in general has fantastic tutorials, including these things they call codelabs which take you step by step on basics of each of their ten hundred thousand million services. Including DataProc. This is the one I used to get started. They start at the creating a project level, meaning all you need is a (free) Google Cloud Platform account.
The above tutorial was a great, quick way to stroke my ego and reinforce my knowledge of the first few digits of pi. But I wanted to go a step further. Here are a number of other tutorials.
We all know I’m a huge fan of Monte Carlo simulations, so I went with the Apache Spark Monte Carlo tutorial. This tutorial is a bit more complex, so we’ll do it together, with some of my own annotations.
I think all the steps until here are pretty straight forward:
From here, you have three choices. You can use the command line, a REST API, or the user-friendly, clickable Console. Using the Console is very easy, but I highly recommend getting used to the google cloud sdk on the command line. Installation is pretty quick, especially with Google’s (unsurprisingly) meticulous documentaion.
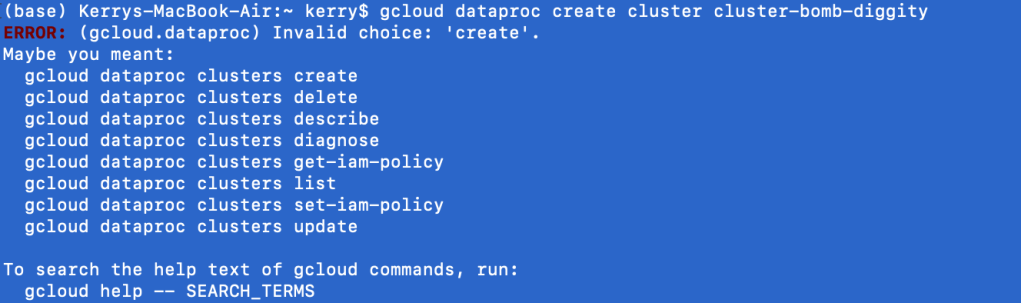
Once the sdk is installed and you have completed gcloud init to configure your machine with your GCP account and project, try the following command:
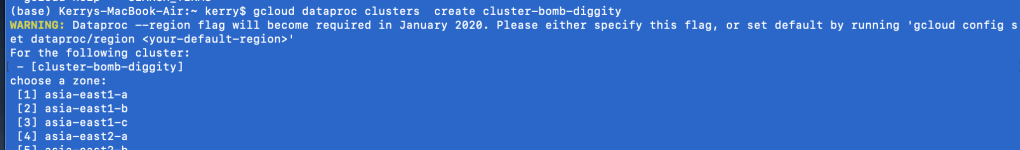
The first lesson of the google cloud sdk at the command line is you will always say gcloud first, followed by the Google service (i.e. dataproc). What comes next is always shifty. clusters create or create clusters? Depending on the service, the English may or may not make sense at the command line. In the case of DataProc, it does not. Regardless, Google is nice enough to give us some hints. clusters create it is.
I’ve entered the noun before the verb begrudgingly, and find I get a new output, which is sometimes a good sign. Like a good programmer, I ignore the warning. I’m kidding. It’s asking me to specify a region, because it doesn’t like to assume. That’s good, you should really never assume things. Google sets a somewhat local region for your default if you don’t bother (which I don’t).
Listen: cloud platforms are cheap because they have tons of servers, ready to go. So if you use 1 or 5, it’s not a huge cost to them, and they pass on the savings to you. This is all people are talking about when they say the cloud is scalable.
Of course, despite calling it “the cloud”, these servers, or virtual machines still physically exist in certain places. It makes the most sense to use servers closest to you, for low latency (the shorter the distance, the faster the response time, but when the scalars are in nanoseconds, who cares unless we’re High Frequency Traders, which I am not). Side note: I’ve never tried using a region across the world, but Google would probably be like, no.
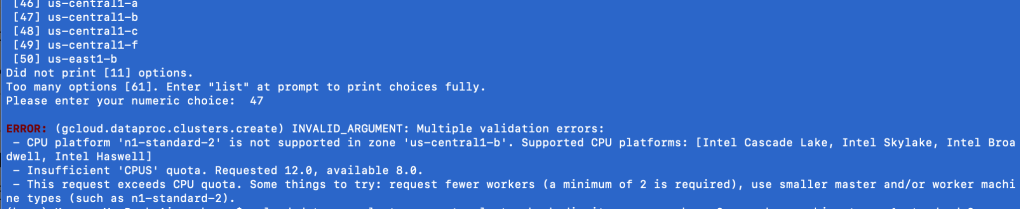
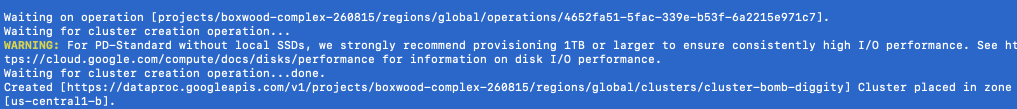
Moving on from this mini-lesson on the cloud, regions, and zones, I did get another error trying to create a DataProc cluster from the command line using the google cloud sdk. You might get a similar error.
What is this error saying anyway?
Go back to that image in your head of all the “cloud” servers, chilling by region, by zone. Think of each server individually.
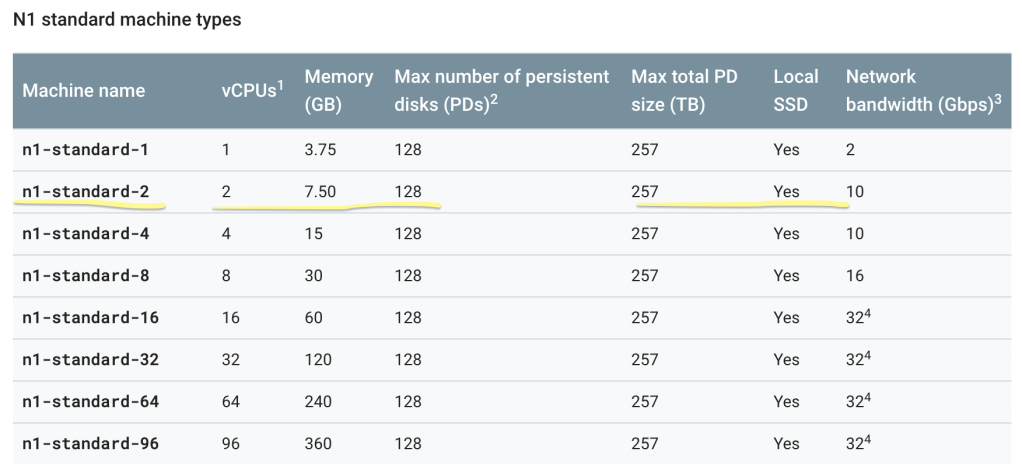
Not all servers are created equal. Some are more powerful than others; naturally, the cheaper, the weaker. As a GCP Free Trial user, n1-standard-2 is your new best friend. It’s the best you can get without racking up a huge bill. If you’re interested in other machine types, Google is very transparent about them, be it size or cost. Here’s the command you need:
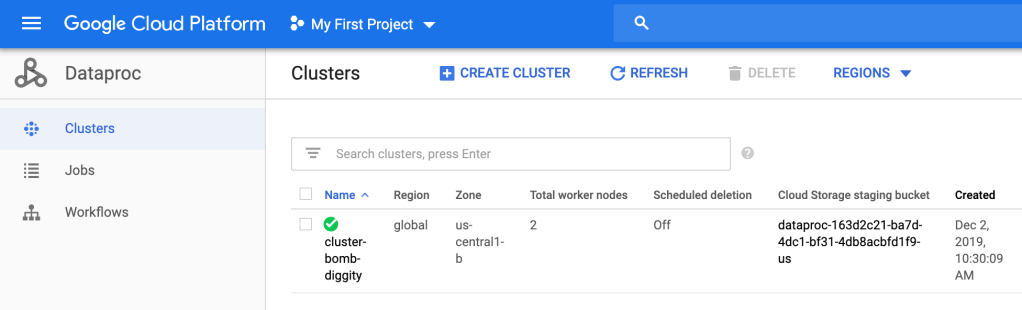
Then you can go into the Cloud Console and see that cluster-bomb-diggity has been created.
Bomb diggity.
So.. what did we just do? Well, a cluster is an environment where you will have at least one master node and, at least for DataProc, at least 2 worker nodes per master. These nodes will run your jobs lighting fast due to the MapReduce algorithm and HDFS. We have just set up the environment; we created a master and 2 workers on a n1-standard-2 machine, which has 2 (virtual) CPU’s, 7.50 GB, etc.
The next thing they have you do is “quiet the logging.” I assume this is a billing thing, but I don’t really know. Maybe Google knows their logging is borderline overkill, so they’re casually teaching people how to — “quiet the logging”.
This step is by no means necessary in my opinion, so if you have trouble with it, feel free to skip. But it’s great practice, so I encourage you to try.
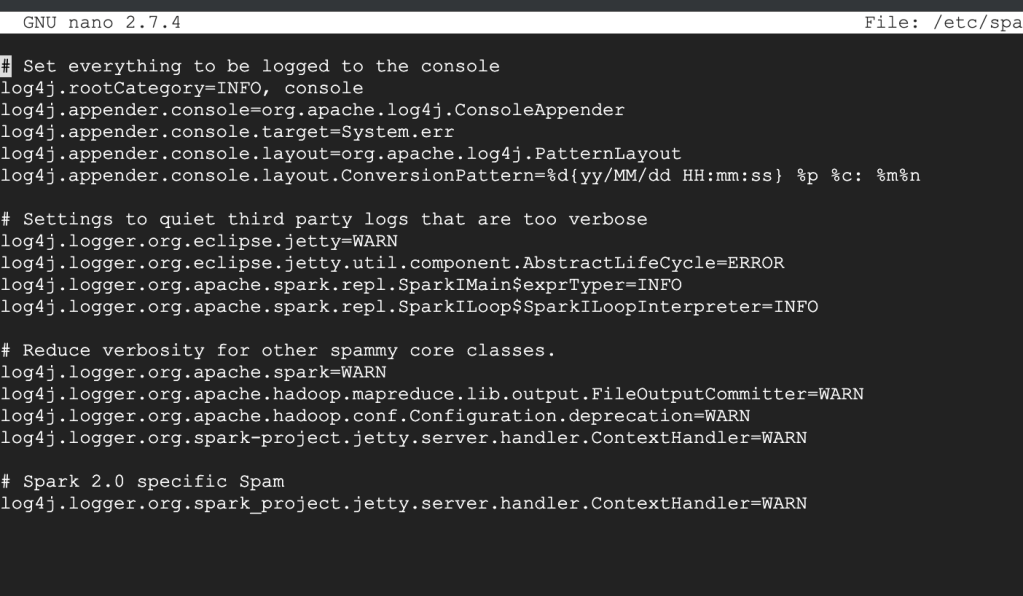
Ok: your properties file should look something like this, where log4j.rootCategory=INFO (second line).
What you should see before making the changes
All you’re going to do is set that log4j.rootCategory=ERROR. That’s it.
To get out of this thing, look at the bottom of the screen for instructions. It probably looks foreign, so give it a minute or 2 to sink in. What worked for me is Control+X to exit, then it asked if I want to save changes, which I do. Then hit Enter. It’s good practice to double check your work. To view the file, you can use the cat command:
cat /etc/spark/conf/log4j.properties
You will actually do this 3 times, one for the master, and one for each of your 2 workers.
Stay in the ssh for the master (primary) node. Enter exit to leave the ssh for both workers. After following the remainder of the directions, you should see something like this:
You can follow the Scala instructions next, if you’d like; this server has it installed. Notice how the python version is 2.7. Since python 2.7 is being deprecated, it will be interesting to see what Google services will continue to use python 2 after January 1st, 2020…
Make sure to delete all resources after experimentation so as to not be charged, and to check out this guy talk about Spark in more detail, including examples with DataProc!
Maybe your job is making the switch Enterprise-wide. Maybe you got a new job. Maybe you bought yourself one for Labor Day because …. why not?
First of all, what is Windows? What is Mac? Are these even the right terms? That depends on what you mean. If we’re talking operating systems, which is usually what people are referring to, you’d really say MacOS versus Windows. But if you’re talking about the brand, you mean Apple versus Microsoft. But just about the metal computer machine things they sell. Portable or not. You’d probably say Windows versus Mac.
Listen: just because Coke and Pepsi are #1 and #2 doesn’t mean you should ignore RC Cola. I’m talking about Linux. Or Unix. No one really knows the difference. But this is the truth: Linux is like Unix, but with magic powers.
Anyway, congrats on your new Mac. For your first lesson, press Command + space. If nothing happened, press Command first, then space (but do it quickly, like no slower than two beats from GZA and Method Man in Shadowboxin).
This is all you have to know about Macs. Their folder structure is a total mystery. It has no pattern. Then you have Apple Cloud stealing things away like chocolate mousse disappears off a dessert tray. But what’s really important is you can drag things from the Downloads folder, and it cleans (deletes) Install files for you. Macs are p classy.
The best way to start your day is opening up a 2-pound laptop that somehow has 512 GB of RAM shoved into it (caugh cough, saudered tight), command space ‘t-e-r-m-i’ + return. That’s right: The return button. Windows calls it Enter. It’s literally the same thing. This is how companies fight. It’s really adorable. Macs don’t capitalize their do-everything button. It’s because they’re above that.
But yeah, Macs care about appearance, so you can make your terminal all custom. Mine’s blue, like whales in the ocean.
I finally caved on Anaconda and it was like, the second thing I downloaded when I got my new Mac. And I recommend you do the same. Anaconda is like your DIY-data-science tool. It’s free. My Mac wasn’t free, but this fun stuff is. Anyway, I downloaded it so fast because my 2019 Mac had python 2.7 as it’s default???? That was super weird to me. Will python 2.7 really be deprecated? Is Apple hinting they’ll take care of it?
You should literally never code like this. It’s healthier to start your day out by opening a Jupyter Notebook and having it just running, waiting. Because even though it takes less than a second to open the python interpreter, you’re going to write so much code and it’s going to work so well that you’ll spend the next 30 minutes copy and pasting it and formatting it over. Don’t trap yourself into that corner…
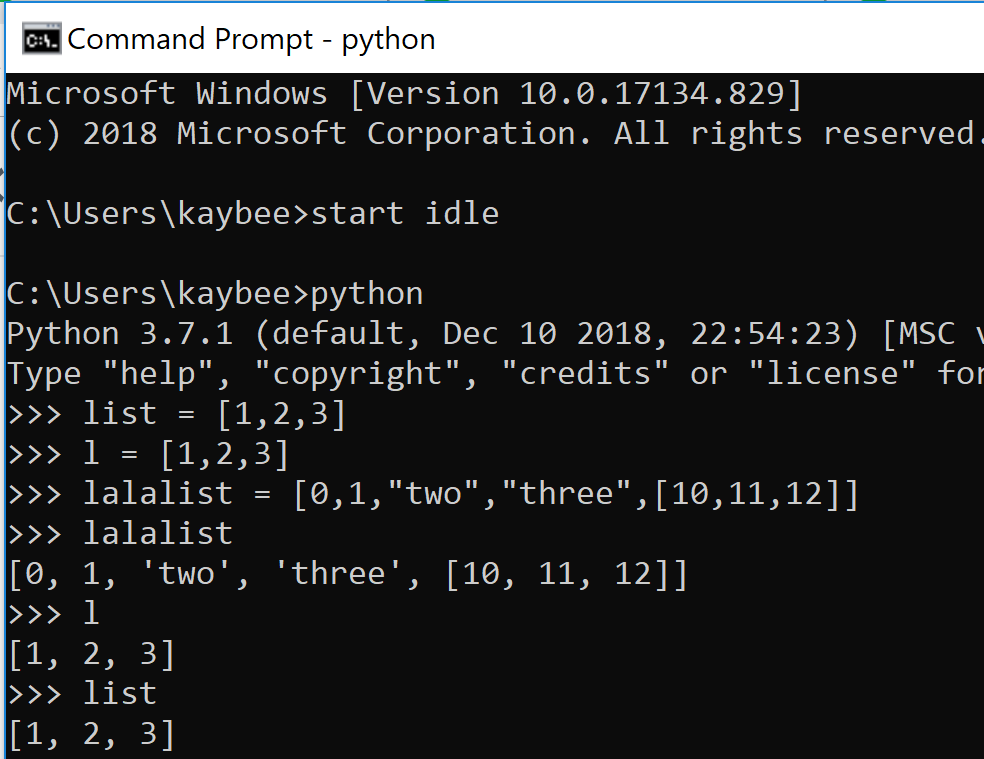
As you may recall, a list can be something like [1, 2, 3, 4]. In python, each element of a list does not necessarily have to be the same. A list can also be, if you really insist, [1, 2, “three”, True, 3.14]. Keep this in mind and consider what a list of lists could be.
[[1, 2, 3, 4], [“one”, “two”, “three”, “four”]]
A list (outside). Of lists (inside).
While the list of lists demonstrated above should really be a dictionary such as {“one”:1, “two”:2, etc}, sometimes, other tools don’t support dictionaries. Sometimes, you might even end up with a list of lists of dictionaries of tuples to lists of other dictionaries of strings to more lists, which would look something like (but with data) [[{():[{"":[]}]}]].
In spite of this post, I am not against to using multi-dimensional collections, albeit there being plenty of layers to get lost in, commas to miss. They might be prone to human error, but what isn’t? Why learn yet another tool when it seems like by the time I learn this one, a new, better tool will exist with all the market share, forcing me to learn that one, too. This isn’t being cynical… it’s being practical.
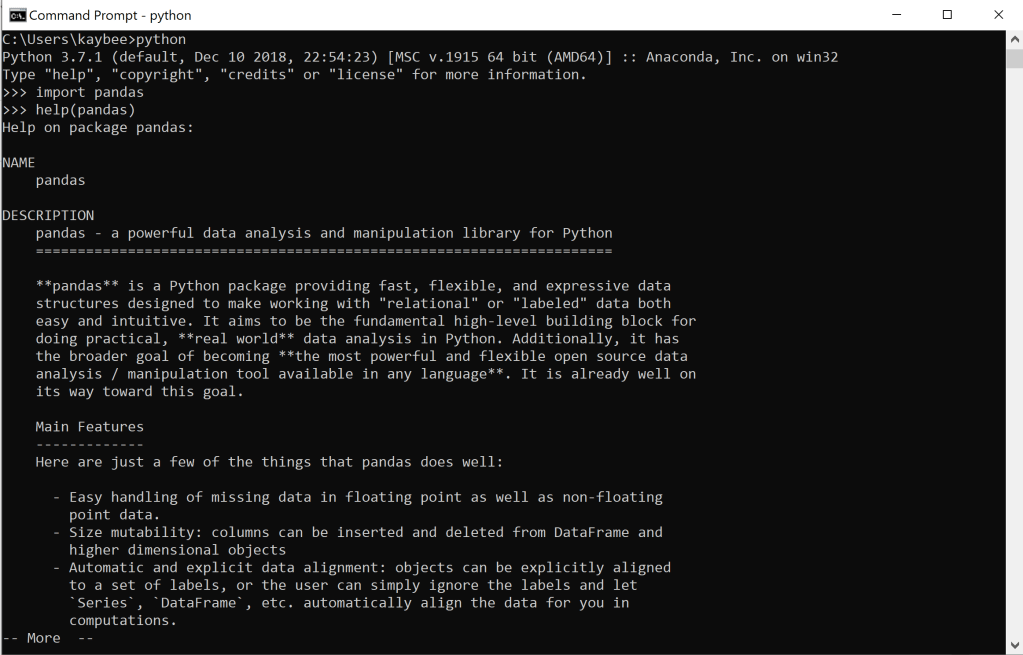
pandas is derived from “””panel data””” and is a stretch of an acronym for Python Data Analysis Library
One of the biggest challenges of programming is not programming itself, but the data on which the program is run. Data, like most of life, is not perfect. In fact, data is usually filled with mistakes, random & uninvited characters, and might technically be structured but no one really followed the rules. It is important the data is not this useless for conducting analysis, otherwise our analysis is useless and — worse — our time wasted.
Pandas can clean. Cleaning data with pandas versus multi-dimensional collections is like the difference between cleaning a house belonging to 2 working professionals without kids, and a 2 bedroom apartment where 6 people live with 2 dogs.
Once the data is clean, you proceed with your magic: also using pandas. Merge multiple data sets, assign indices, name columns, remove or replace missings, search for outliers, remove or replace outliers. You could also do this with multi-dimensional for collections and for loops. This is recommended for people with too much time.
First thing to know about pandas is that it supports the essential datatypes. These include numbers (ints and floats), Booleans, strings, and dates.
Listen: you can put a date in a string. You can put a number in a string. You cannot put a number in a date. You cannot put a date in a number. Sometimes, you can even put a Boolean in a number. You can definitely not put a Boolean in a date.
The documentation explains crucial information such as a package’s methods, or the functionalities of a class. For the pandas class, this dtypes method will always tell me what data type an item belongs to, for when it isn’t obvious. It might seem obvious, but listen: deduction isn’t foolproof. It may look like an int, but is it an int? dtypes will always tell you the truth. Always go straight to the source for the truth.
If you now consider yourself a hacker-into-the-matrix and web browsing is beneath you, or if you’re coding without WI-FI, help() is another way to find out about all the methods of any package
How to use pandas
Only use when necessary (i.e. if your data set is sufficiently large, or if you are 3 or more degrees deep into a multi-dimensional collection)
Errors included as a friendly reminder that being a pupil is making mistakes and I will always be a pupil
I was going to do a post on Cloud Computing with python but both Amazon and Google are sending me emails about free trials ending and credit cards expiring so that will wait.
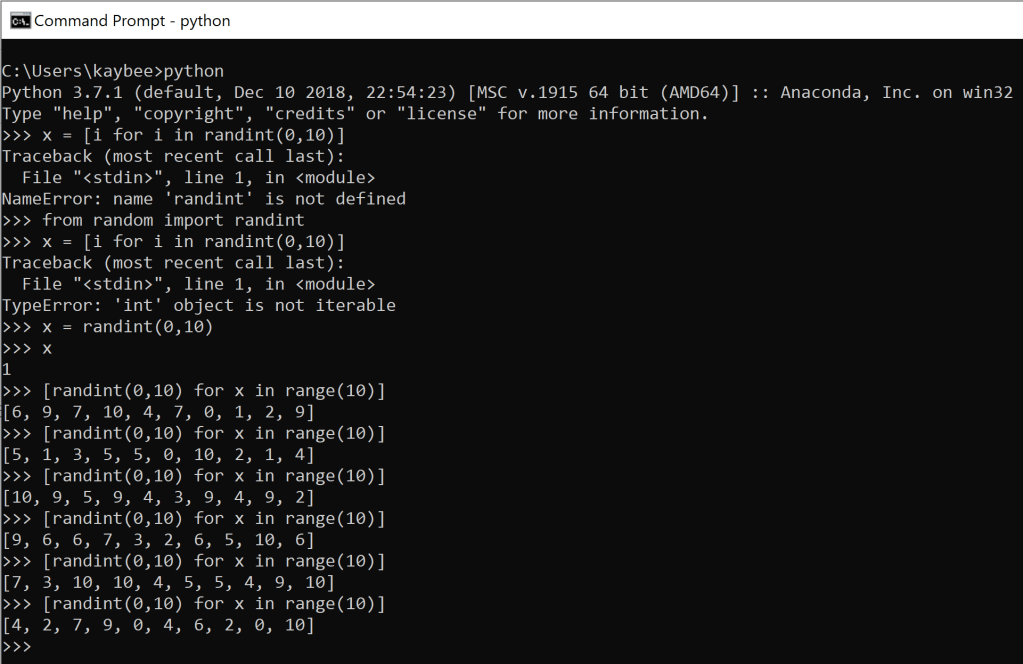
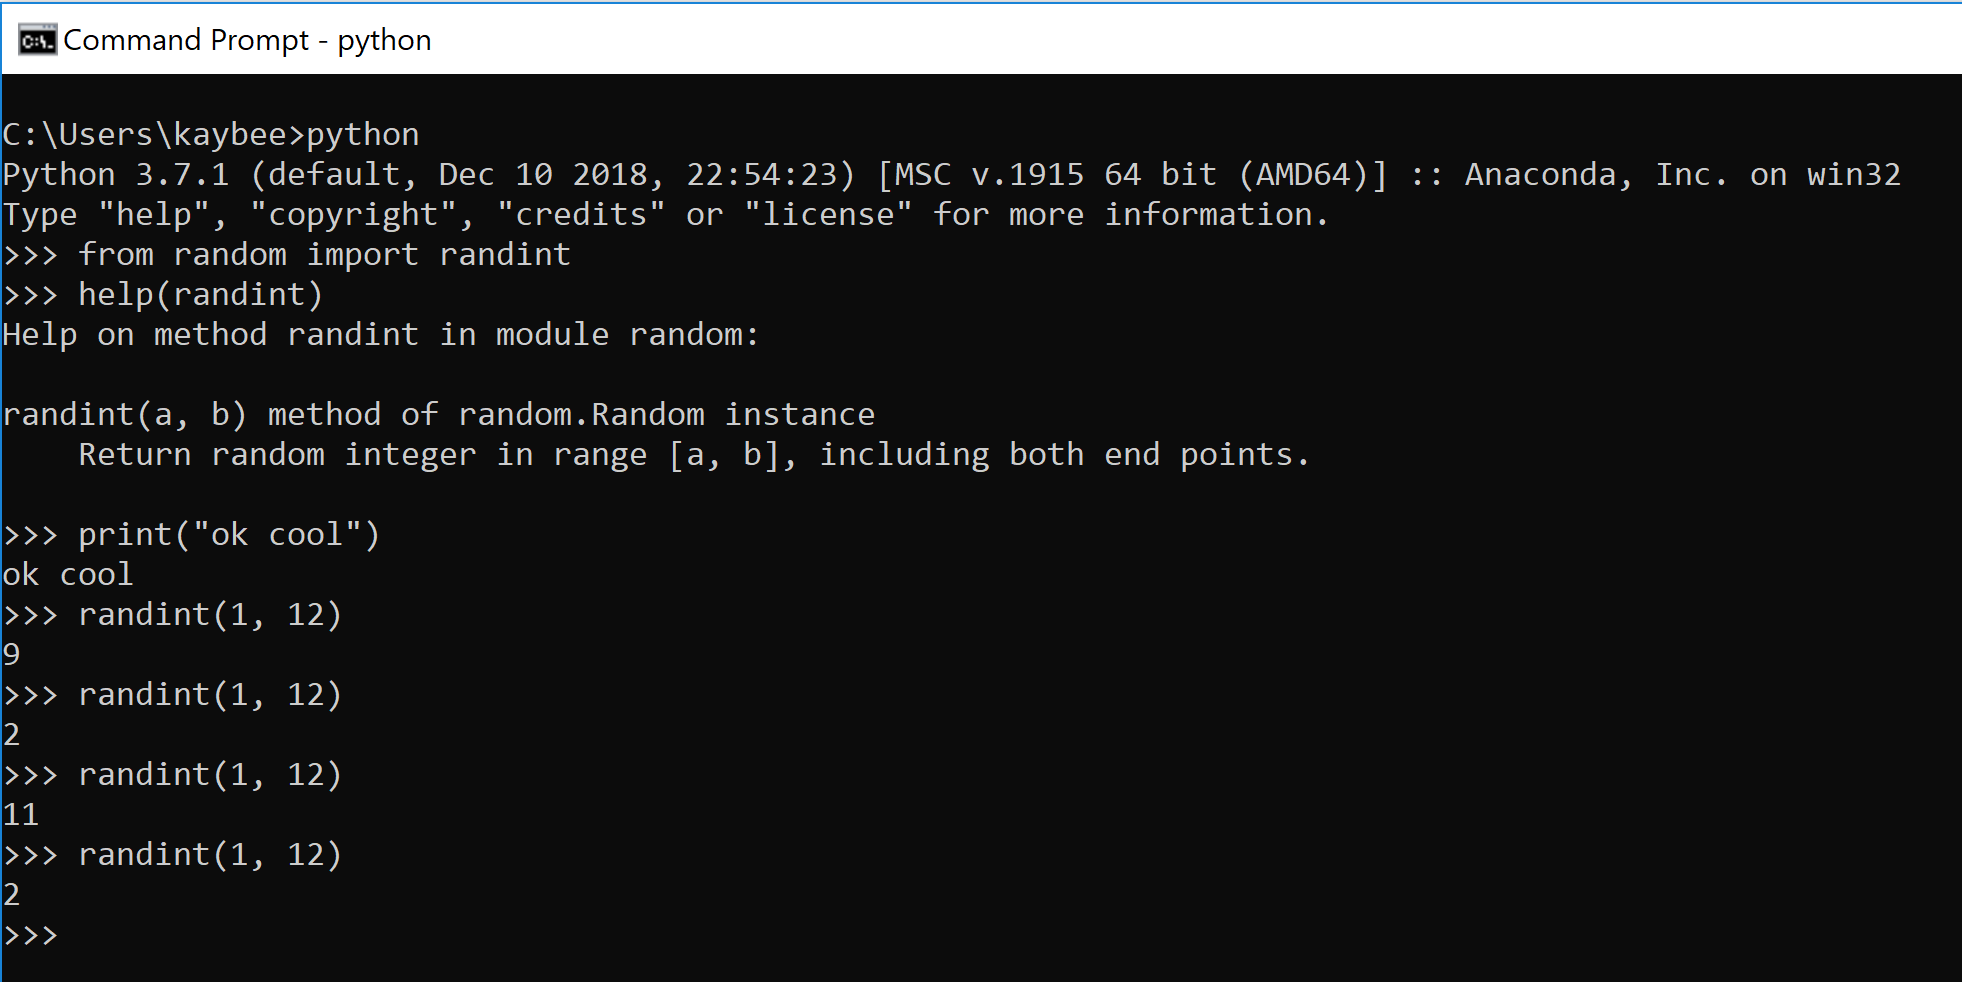
What you see above is a few attempts made in a Windows command prompt running python to spawn randomness. The randomness comes in instances of a list, generated by a list comprehension, of 10 numbers (denoted by range(10)) that are between the parameters of the random package’s randint, 0 and 10, inclusive of either.
The reason you see the same thing so many times is because I was pretty surprised that I got it to work so quickly, so I kept hitting enter to double check it was working properly. It was! They all came out with different numbers, exhibiting evidence of randomness. As a happy result, I had a little sampling distribution. So I decided to go a step further and auto-generate that too with arbitrary numbers.
x is a great variable name for experimentation purposes but listen: never actually use x as a variable name
List comprehensions are like the invention of self-cleaning ovens. Elevators. Zippers. Initially, they’re relatively challenging alternatives to slightly more otherwise laborious albeit easier-to-understand work; once you have them down the easier alternative really isn’t all that much easier.
How to Make a List Comprehension:
Since you are producing a list, you start with brackets, like any other list []
If you feel totally lost, just write [x for x in range(10)]
See what the above results are
Change your list comprehension slightly by trying out something like [x**2 for x in range(10)]
Familiarize yourself with the syntax…[expression_using_thing_as_abstract_variable for thing in some_range_or_other_existing_list]
Experiment & keep practicing
Notice how the expression_using_thing_as_abstract_variable part can be another list comprehension. The some_range_or_other_existing_list can also be another list comprehension. I do not recommend double list comprehensions until you feel comfortable with the basics, but I also won’t tell you how to live your life. For more information on the basics, python as always has excellent documentation.
Okay: say you just moved into a new place. Great new spot. Lovely amenities, nice neighbors.
Unfortunately your commute is a whole 7 minutes longer than it was from the old place. 7 minutes! Imagine what you could do with that time.
Obviously you can’t just claim your commute is 10 minutes (to round up, because life’s a drag) longer after 1 day. What time did you leave? What was the weather like? Was there a baseball game the night before (if you live in Chicago you know why this is relevant)? What day of the week was it? Etc.
Just like Kanye says you are not your mistakes, a single day does not represent all the days. You need a bigger sample size.
So how many days do we need to sample in order to represent all the days? Depends on who you ask. Depends on the data, the industry. The Central Limit Theorem (usually) says 30 is a sufficiently large sample size to obtain normally distributed data, such that our sample mean x̅ (or “xbar”) is approximately our population mean μ (or “mew”, the Greek letter for m, for mean). It also tells us that the larger the sample size, the better approximation we have; the bigger the count of observations, the closer we will be to the true mean.
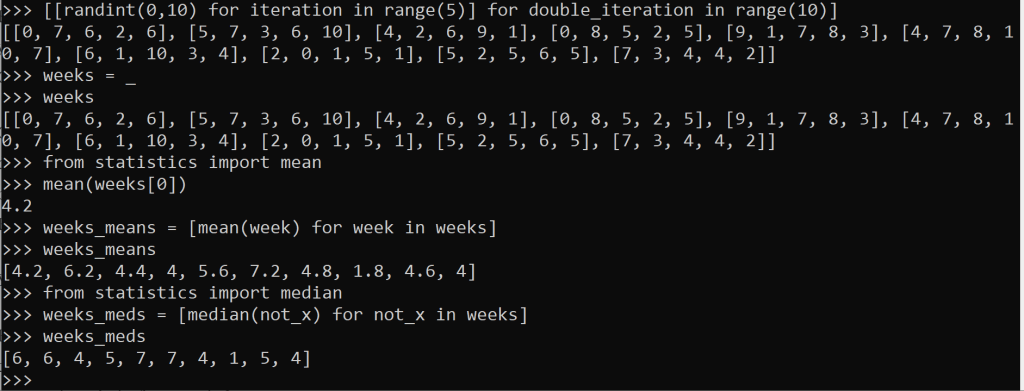
But there’s still bias because Mondays are different from Fridays in terms of commute times. Everyone knows that! What if we recorded our excess morning commute time compared to the previous commute, every day, for 10 weeks? A sampling distribution.
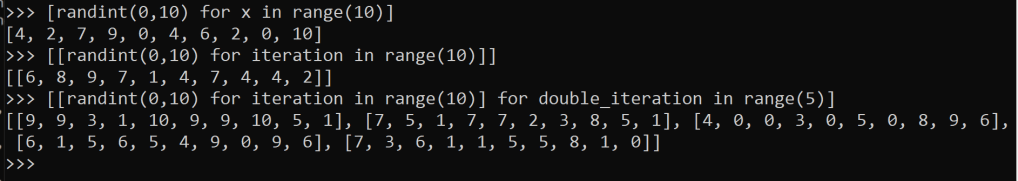
how to get the means and medians of a list of lists? another list comprehension
The data from that 10-week interval is generated above. I see some 0’s, which could mean our commute time was 0 minutes longer than the previous commute. Or does it? Maybe we worked from home. Maybe it was a holiday. We called in sick with a fever. Or, equally if not most likely, we were just living our life and forgot to record anything that day. Maybe the 0’s are really missing, or null values.
Maybe they’re some combination.
Listen: a good data set has these types of things explained in some metadata file sitting next to the data itself. The data has flaws. It will never not have flaws. If the data set claims to be perfect, you should certainly avoid that data set like the plague (unless you’re Arnau from La catedral del mar and you’re immune, then avoid it like Aledis).
There are a thousand python packages out there that are more user-friendly and formatted and also find the mean and median and whatever else you need. Pandas is the most popular, in conjunction with numpy and sklearn, even matplotlib if you like to graph stuff. In production code, these packages are probably essential.
During the experimentation phase especially, I like to keep it simple. The more fluff you have, the more room for bugs to hop on and hitch a ride. But we’ll go over how to use pandas next (and eventually, Cloud Computing… and Algebraic Data Types).
You could always collect your own data, albeit this is no easy task. Would we implement surveys? How would we pick the right questions? Could we auto-collect it from some handy dandy system that’s already automated anyway? Stream it right into our database? Remember the last time something was as easy as it seemed? Me neither.
I struggle with the idea of just yoinking something from the Internet and it being totally fine. I’m sure a lot of datasets are safe, well maintained, and totally legit. But you never know know unless you get it straight from the source whether a set of data has been tampered with, be it intentionally or not.
Public datasets can also be difficult to use when you are brand new and self-taught. How do you clean data? How do you know if you have to clean the data? How do you import data? What’s a relative path? What’s an absolute path? What’s a path?? What is data?
Meanwhile, with the abundance in general data availability, you are bound to select something familiar to you. Something you already have opinions on.
This is called, bias. And bias is bad. If you decide what the data is telling you before it says anything at all, that’s bad. Not that you would do such a thing on purpose. But that’s bias for ya. Bias would also exist in a tampered-with dataset (intentional or not).
By the way, it’s possible to create your own dataset with essentially no bias. “Random” data. Monte Carlo simulation. And you won’t even have to clean it. Honest.
It’s not a coding blog without Matrix memes
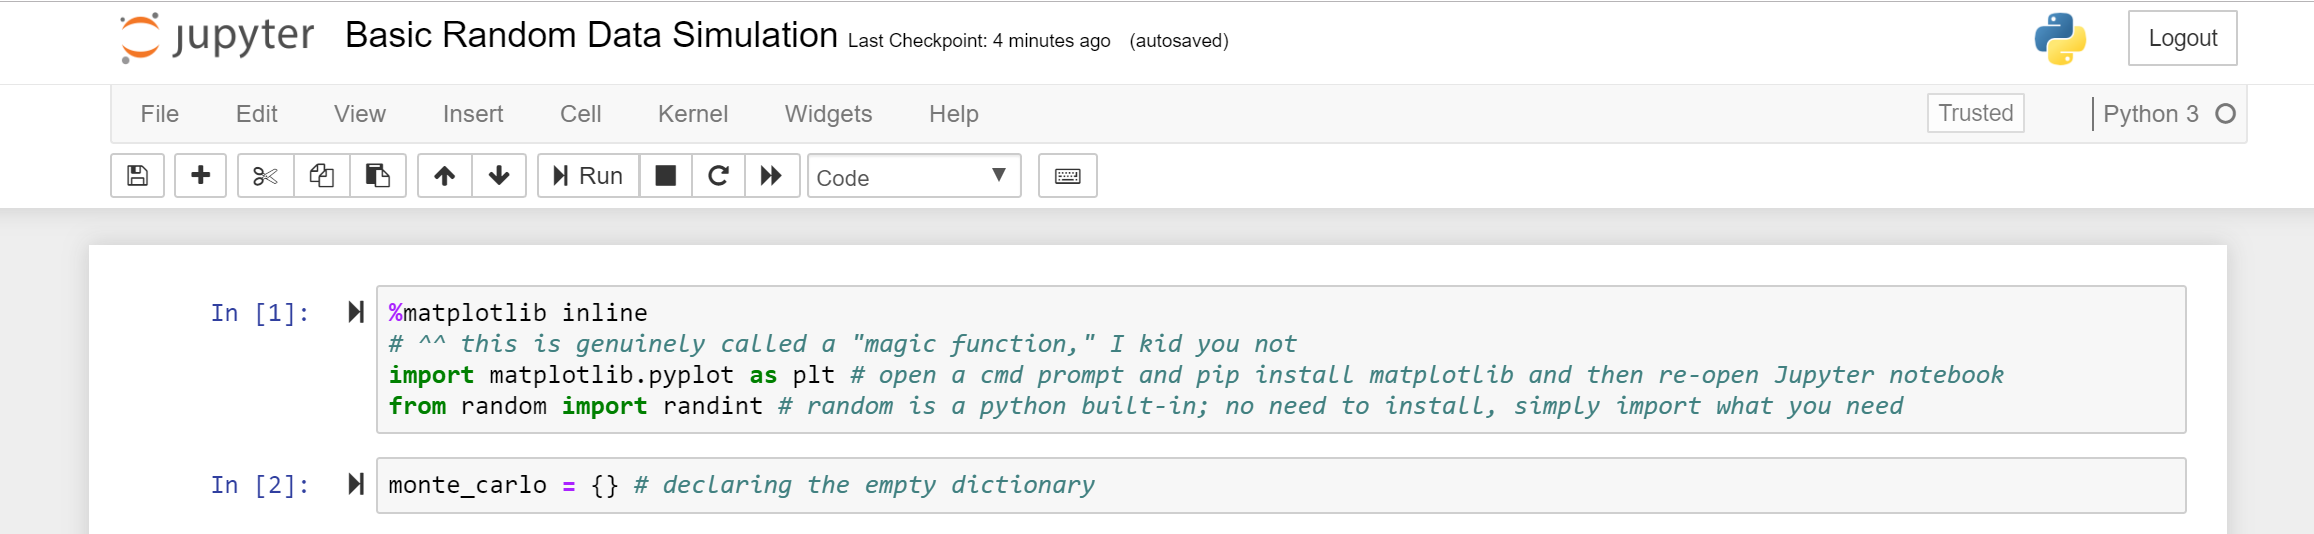
Monte Carlo data is the best data on which to practice one’s python skills (it’s also a great risk analysis tool). Using a dictionary and a built-in python package called random, we will generate random, clean, and unbiased data. But first:
Why is random data not biased?
Take a 12-sided di. When you roll it once, you get a 9. You roll it again.
“Rolling” a 12-sided die here is equivalent to executing >>>randint(1, 12)
You may get a 2, an 11, and another 2. But what if I rolled the di 1000 times? I know, why would I do that? It would take forever. Computers are good at doing the same thing over and over real fast. Let’s have the computer do it.
Jupyter Notebook makes more sense than an IDE (or a combo of Notepad++ and GitBash) or the command line because it is more iterative-friendly. It has these blocks, or cells that you can either run immediately, or ignore. Jupyter Notebooks run in-memory. These attributes enable fast and flexible experimentation.
a Jupyter Notebook
All the code for this exercise can be found here under the folder MonteCarlo. This exercise is called Basic Random Data Simulation.
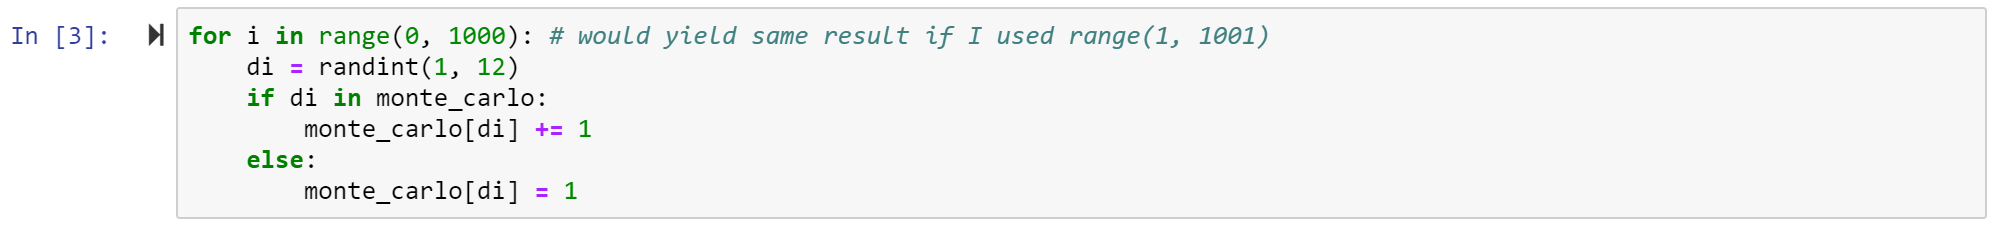
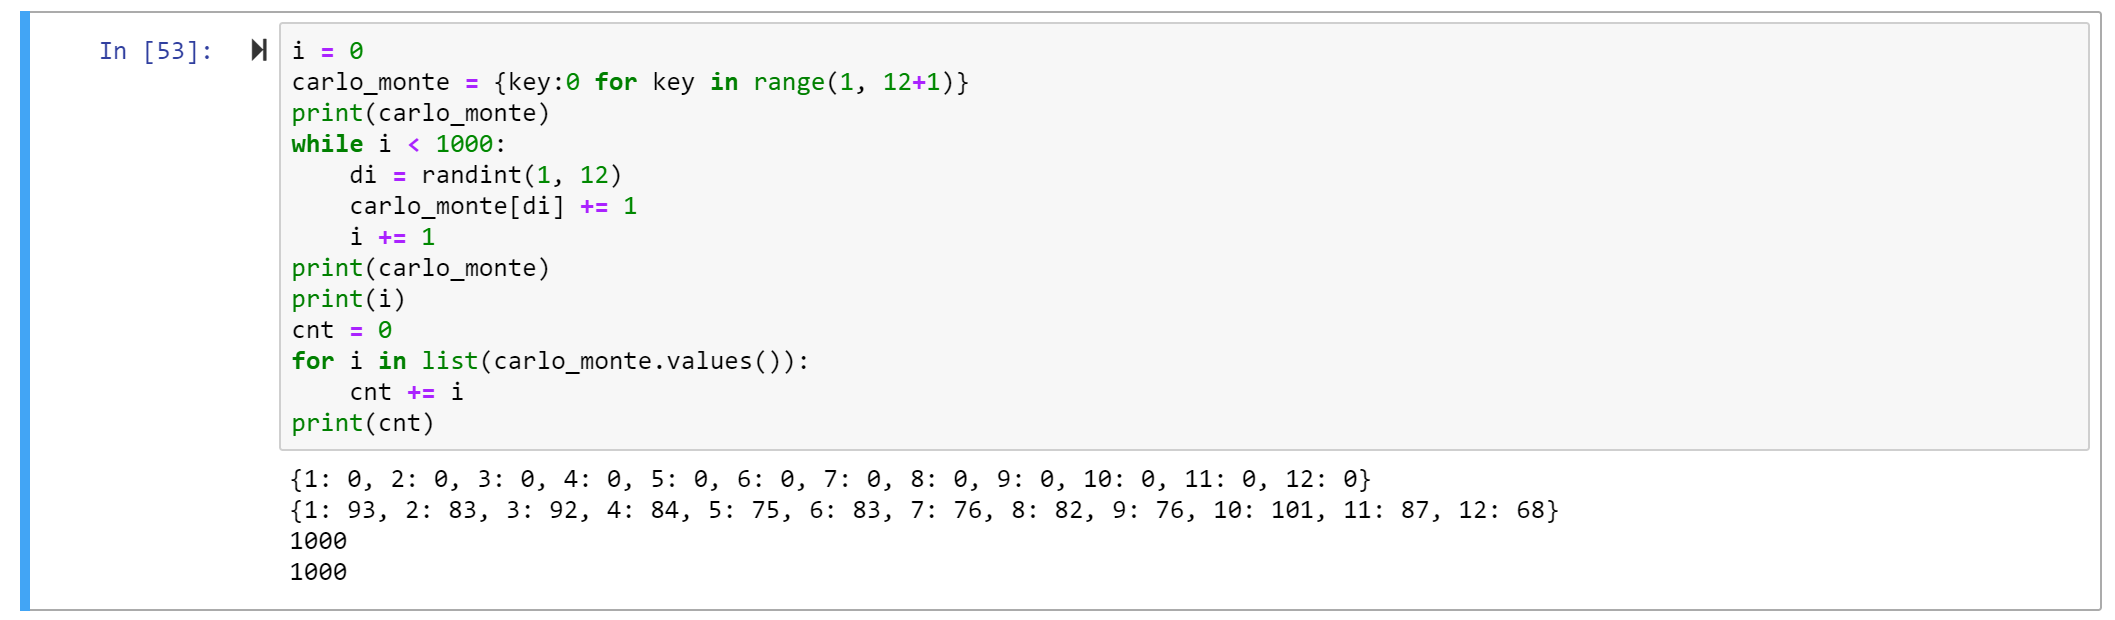
The dictionary monte_carlo will store our data. The keys will coordinate with each side of the 12-sided di. So there will be 12 keys (1, 2, 3, …, 12).
The values will coordinate to how many times that number was “rolled.”
Note: I’m not spelling ‘di’ correctly on purpose… so as to avoid weird SEO things
I used a for loop to generate 1000 rolls. Inside the for loop, which I told to run 1000 times, I roll the di. Say it’s an 8.
If 8 is a key in the dictionary {}, then increment 8’s value by 1. Otherwise, insert 8 as a new key and set the value equal to 1.
Note that in the first few rolls, the else statement will definitely be executed to initialized all the values, but by the time we reach the end of the 1000 runs, all 12 keys will likely exist. At some point, the else statement will be ignored for the remainder of the loop. A while loop would have worked, too.
Let’s try that.
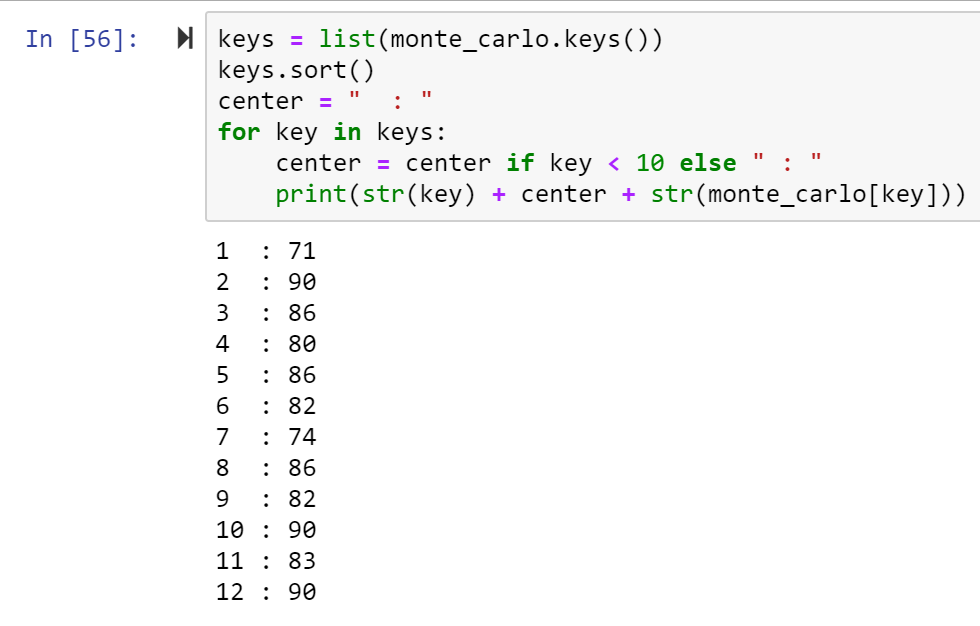
Also, since the keys are knownprior to performing the loop, let’s try initializing them before the loop with a dictionary comprehension. A dictionary comprehension is a way of creating a dictionary without hardcoding stuff. They are useful for creating dictionaries with variable keys and/or values, as well as for creating really, really big dictionaries that would be cumbersome to code otherwise (but still follow some pattern, such as start from 1, end at 12, increment by 1, and initialize all values with 0).
This sightly different method avoids that extra if/else computation. Just like walking, the extra steps come at a cost. And less important, but the else statement is only useful in the beginning of the loop. It’s sad to see wasted potential, you know?
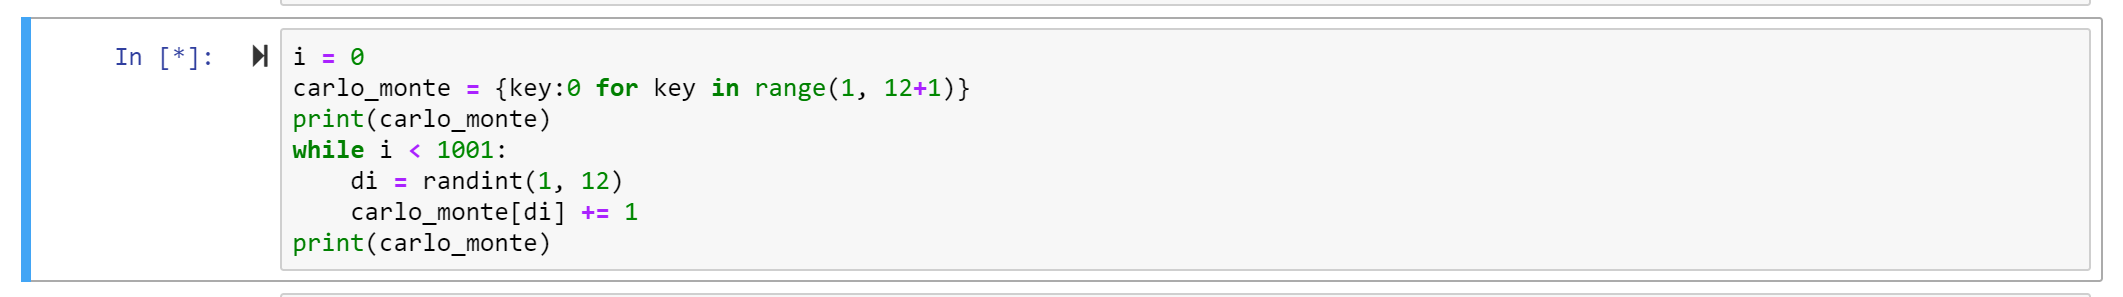
First lesson of while loops is don't let it run forever. Don’t get stuck in forever.
The below code is going to run forever. The i never increments, so i is always zero and we never exit the loop. A faster way of knowing the loop is stuck is the asterisk [*].
This indicates the Jupyter cell is running. More than a few seconds is probably too long. Luckily, Jupyter has a stop button for that (although in theory the loop would run forever, it would actually stop once Jupyter, which means your machine if running on localhost, ran out of memory).
Can manually cease a running cell with the Stop button
Anyway, here’s some code to generate 1000 rolls, no infinite loop, no funny business:
I printed out the sum of all the values because I had initially done while i < 1001 and that was… not right
We can get fancy with printing the dictionary, because why not?
Even with the data printed out all nice it’s still kind of hard to see the distribution. We can easily see like how many 2’s we got this time, but what about how many 2’s compared to how many 3’s? How does the data look relative to one another?
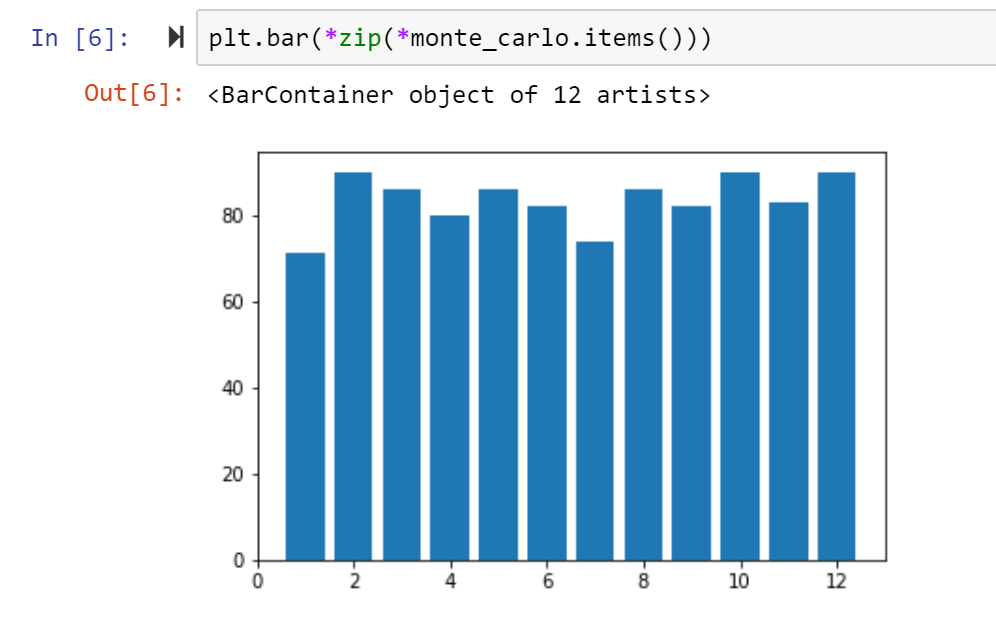
Using the library matplotlib we can create a bar chart to better understand the frequencies of each side of the di. Which key did we see rolled the most? The least?
Note these values may not reflect what was printed earlier because I kept re-generating the random data
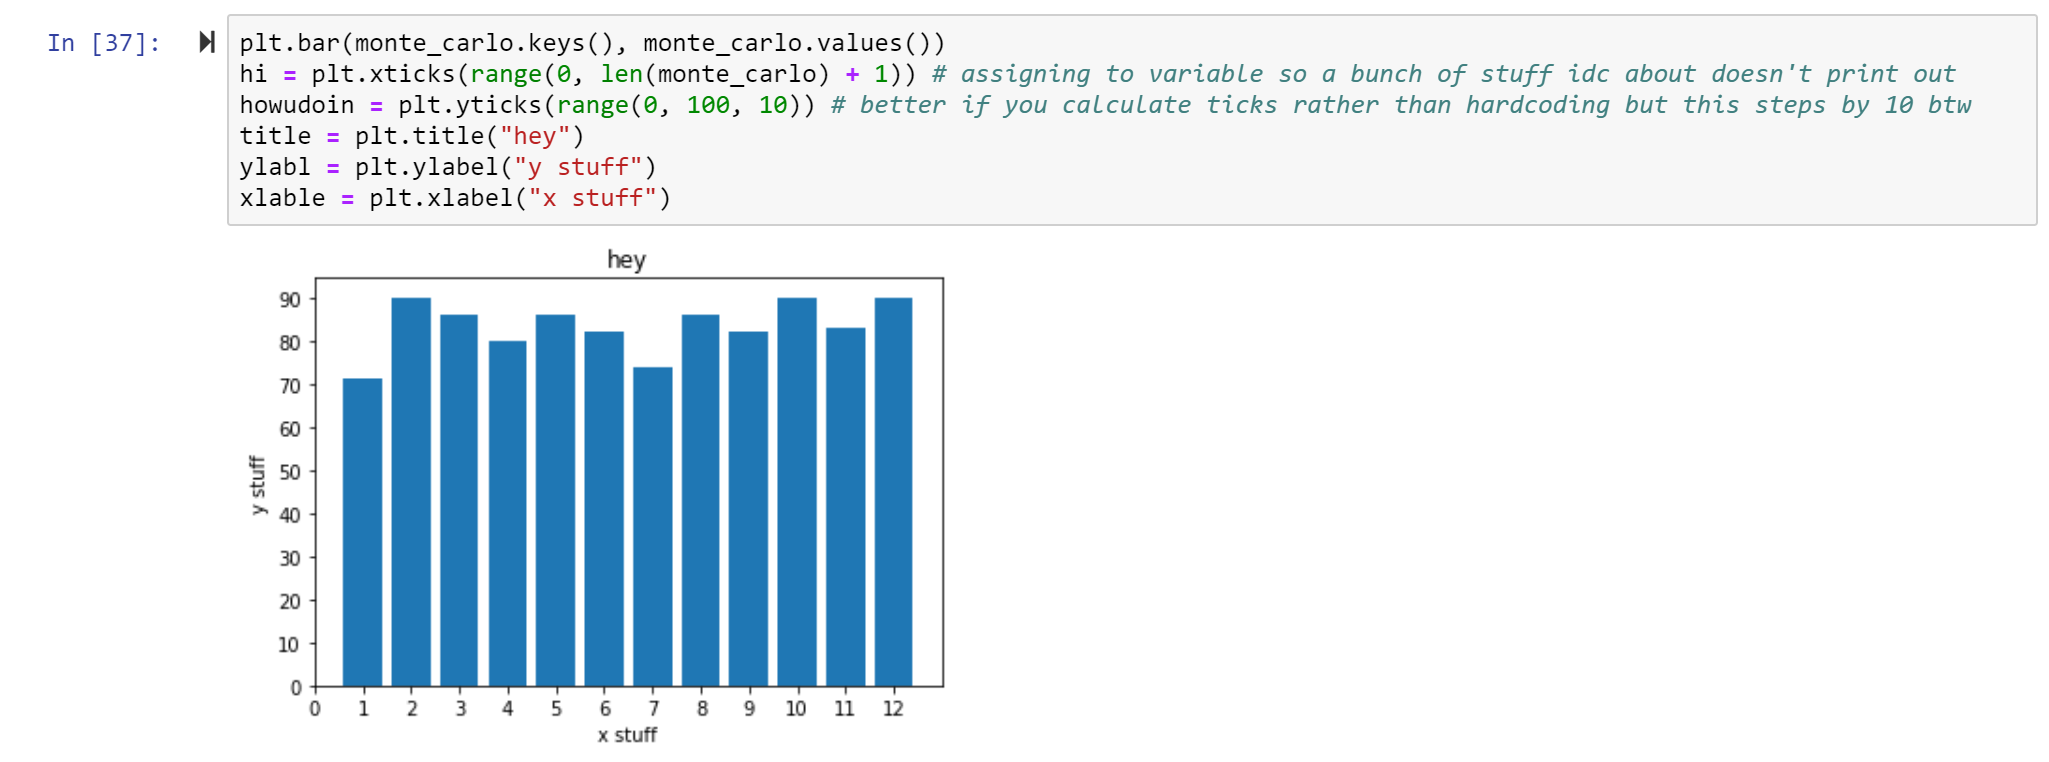
You may agree this graph is kind of weak. First, it’s missing a title and axis labels. We can also probably scale it a little better such that the highest bar is still under a ytick. And add all the keys, not just the even keys.
labeling stuff is important
So… why isn’t random data biased?
Say the computer is on it’s first roll. Say the roll is a 2. Then it will roll again. The next roll doesn’t care whether the previous roll was a 2 or a 3. It will be whatever it is.
Random data is not biased because it does not discriminate. It cannot neglect any certain population. In the di example, there are 12 choices and they all have an equal probability of occurrence.
In fact, if I roll the di 1000 times, this will be more true than if I were to roll the di 10 times. A million would be even better. In fact, the larger the sample size, the more accurate the mean value reflects the population (plus other great stuff).
The only way this data would be biased is if the person rolling the di didn’t record all the 3’s because they hated the number 3. Or if the computer was told to ignore 10.
If di == 10 continue else monte_carlo[di] += 1
By the way, continue is a useful word to use if you’re in a for loop and have a condition where you don’t want the loop to do anything, to just skip to the next iteration.
So, use public datasets all you want. Just remember: random data can't lie.
To begin, you should know something. It’s a word. One word. It’s a weird word. But it’s real. I understand if you don’t believe me. I had doubts myself.
The word is pythonic.
Pythonic is an adjective. You can guess what it describes. But let it sink in for a second. What makes python, python? How is it different from any other language? Python was written in C. So is it also C? Python is object-oriented. So is it like Java, or maybe C++?
If python is your first programming language this might not be funny to you but one day you will understand, like Luke Skywalker
Python is certainly its own language. With time, you will get to know what makes some things pythonic or not. For now, just be aware. Some of these things are python’s “built-ins.” A built-in refers to anything in python you can use without importing.
importing stuff
We’ve learned about the numerical built-ins integers and floats (and complex numbers). For clarity, a built-in is something special to python; a datatype is how the data is considered and stored. There are other datatypes and built-ins, some we will learn in non-numerical data structures. Some we won’t learn. Some are being built as we speak. That’s what makes this programming language so great. There’s a huge pythonic community and anyone can add cool stuff to it (namely, here).
But how does one add to python? Here’s where object-oriented programming comes in. Each of these so-called “built-ins” are constructed using the python class. A class is what makes something written in python like, a thing. A thing you can use later if you want. You simply import the thing. Then you create an instance of the thing locally (“local” refers to on your machine or in your environment). Every thing in python is really an object. Here is a less colloquial but possibly more helpful way of saying that:
” Objects are an encapsulation of variables and functions into a single entity. Objects get their variables and functions from classes. Classes are essentially a template to create your objects. “ – classes and objects by learnpython.org
Those basics down, we’re ready for python.
low key idk if this is supposed to be ET or Yoda UPDATE: it’s actually a dog
Once those basics are down, we’re ready for some non-numerical data structures.
Strings
Today, the word “string” is going to earn a brand new meaning for you.
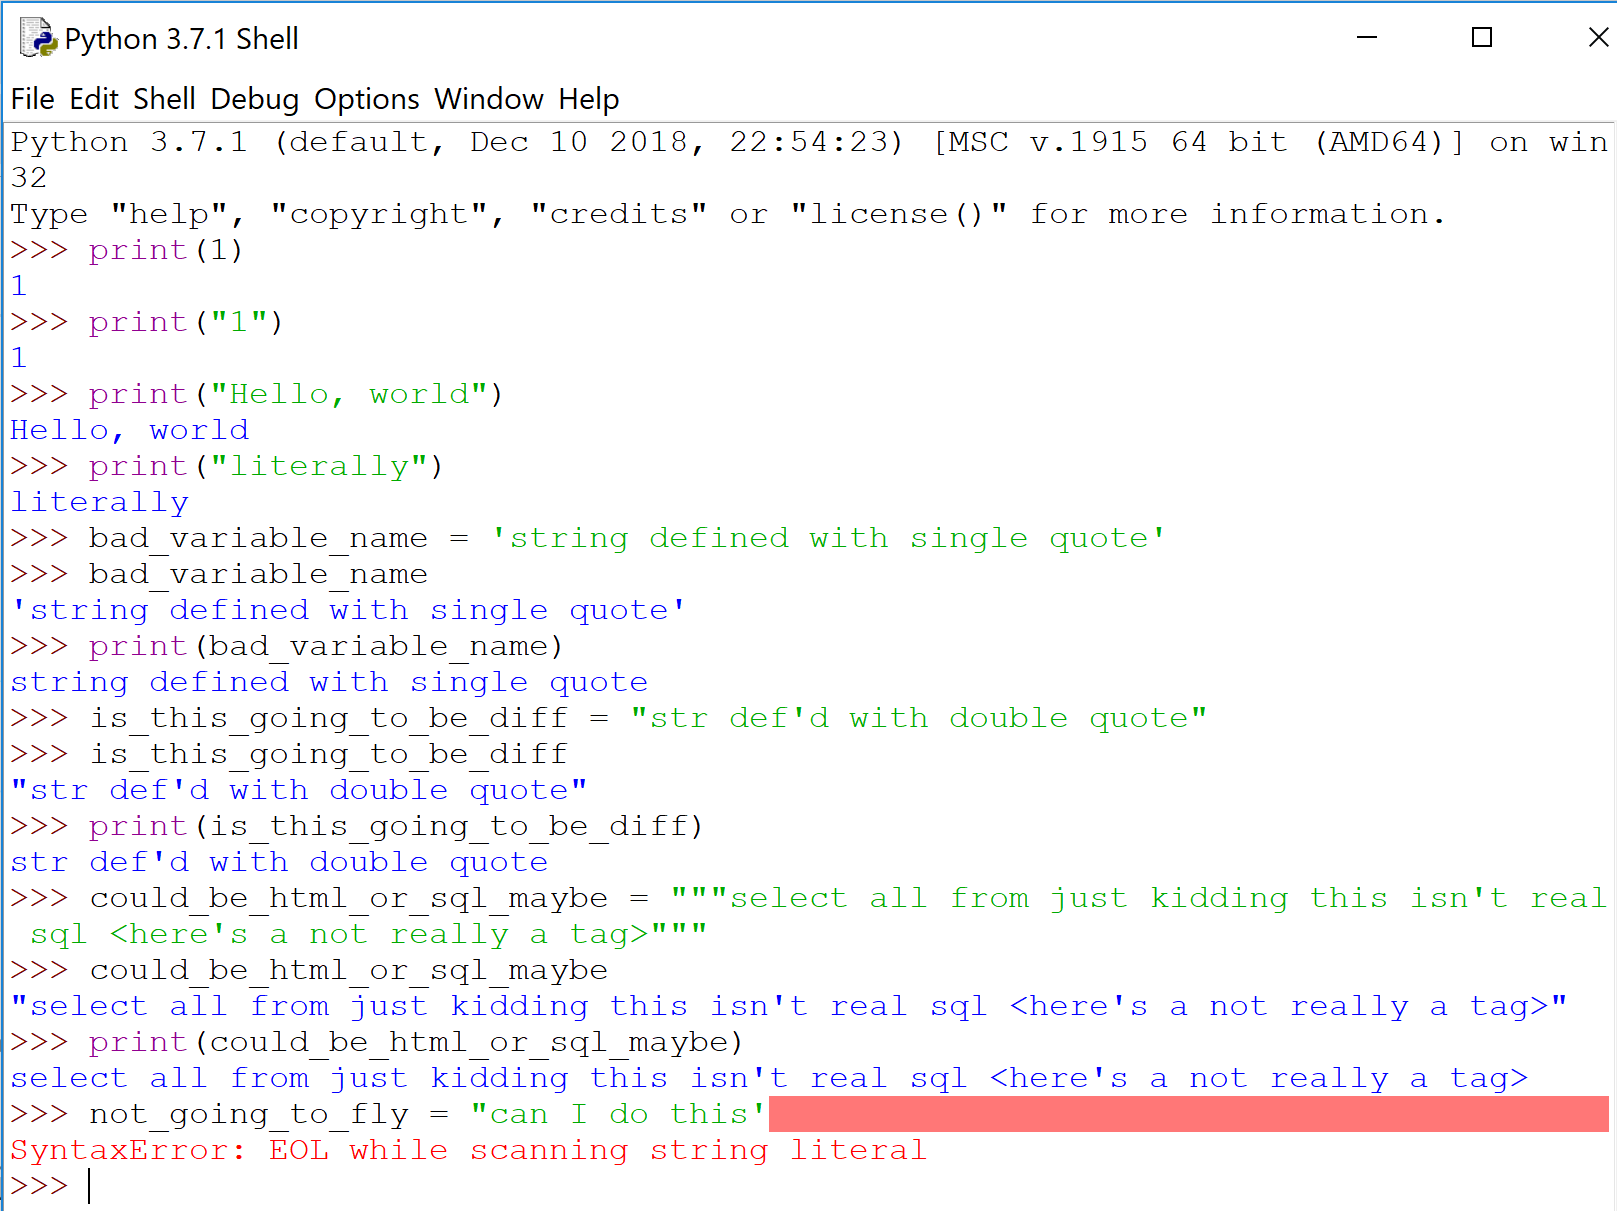
“String” is now going to always be in “quotes.” Because a “string” is represented in quotes in python — ‘single’ quotes, “double” quotes, or “””triple-double””” quotes.
Let me show you what I mean.
You can also put a ” inside a “”” triple quote string “”” and python won’t freak out (there’s also the escape character)
Whether you use double quotes or single quotes is mostly style. Triple-double quotes is conventionally used for multi-line strings. Notice above how python prints with double quotes only if there is a single quote within the string itself; otherwise it will use single.
‘Strings’ are taken literally. You can print stuff with “strings”, like in English. Careful not to use different types of quotes when defining a “string’ — python will complain.
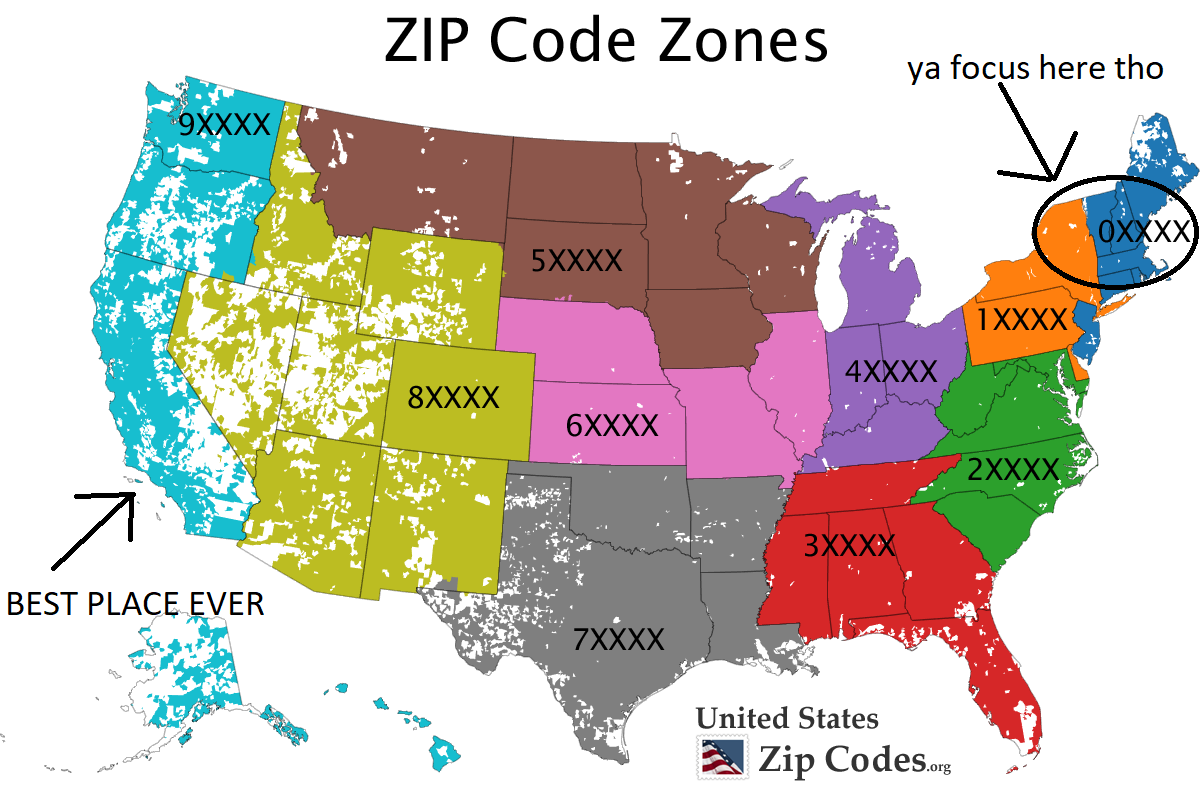
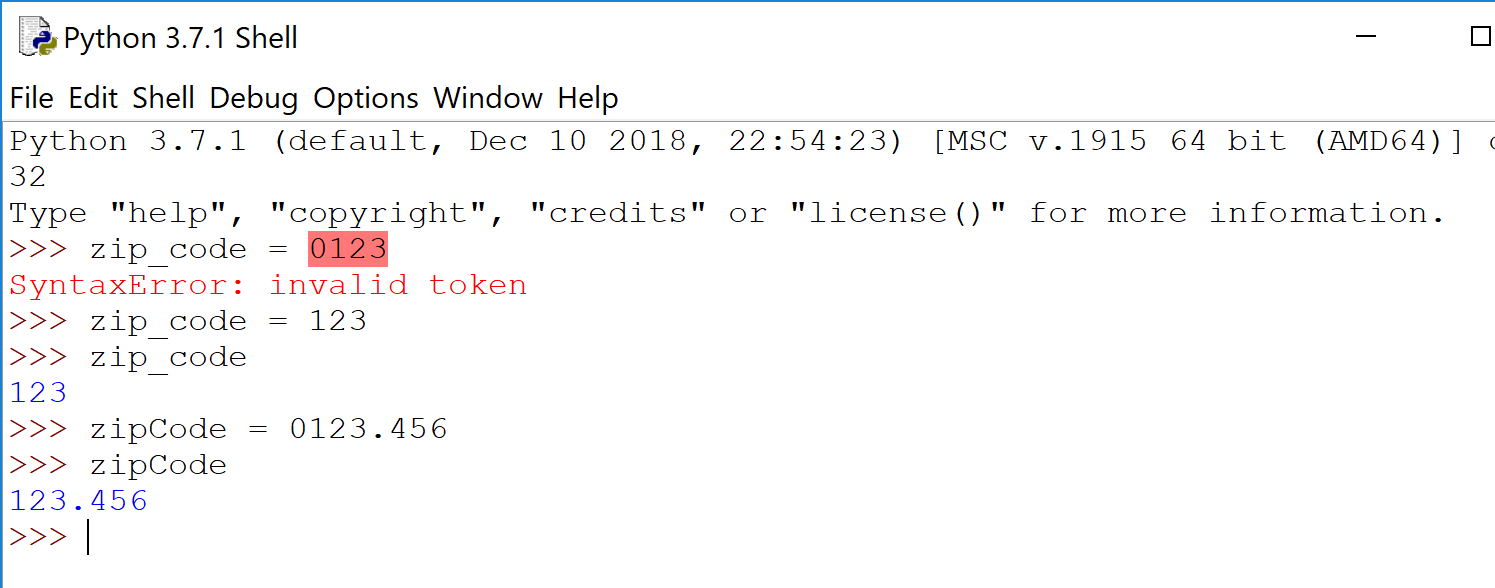
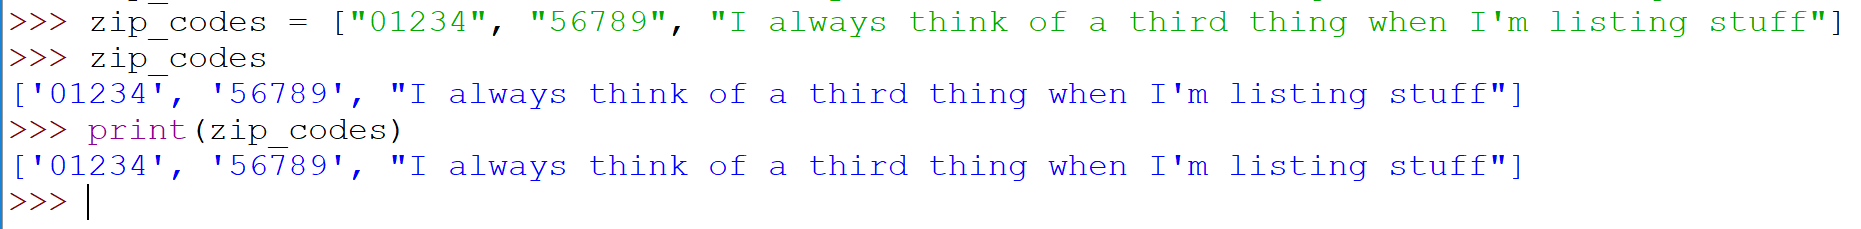
It’s …usually obvious when to use a ‘string’ versus a number. So let’s talk about when it’s not obvious: zip codes. Consider using a ‘string’ even though it’s all numbers. Observe:
90210 is always 90210. 60687 is always 60687. But 01278? Or any other zip code in dark blue up there in the top right? Numerically speaking, 01278 is just…1278.
Python agrees.
Python is either a. not down (if you give an integer), or b. just drops the leading zero (if float). Most languages behave similarly. And when you have a collection of zip codes, or any other numerical codes what begin with a zero, it can be more difficult to spot.
Liz Lemon says to always think of a third thing when listing stuff, and to use the ‘string’ datatype for zip codes
Lists
If quotes is to “string”, then square brackets is to [list].
if you are thinking, uh, “‘list'” is a horrible variable name for a list because it is the python keyword to define a list…you are correct.
A list…lists things for you. It is a collection of things. In this regard, it is like your typical array (from other programming languages). The pythonic list is not like arrays in that you are not limited to a single datatype per instance. You can put whatever you want in there. Ints, floats, strs. More lists. In other words, lists are way cooler than arrays.
And potentially more dangerous.
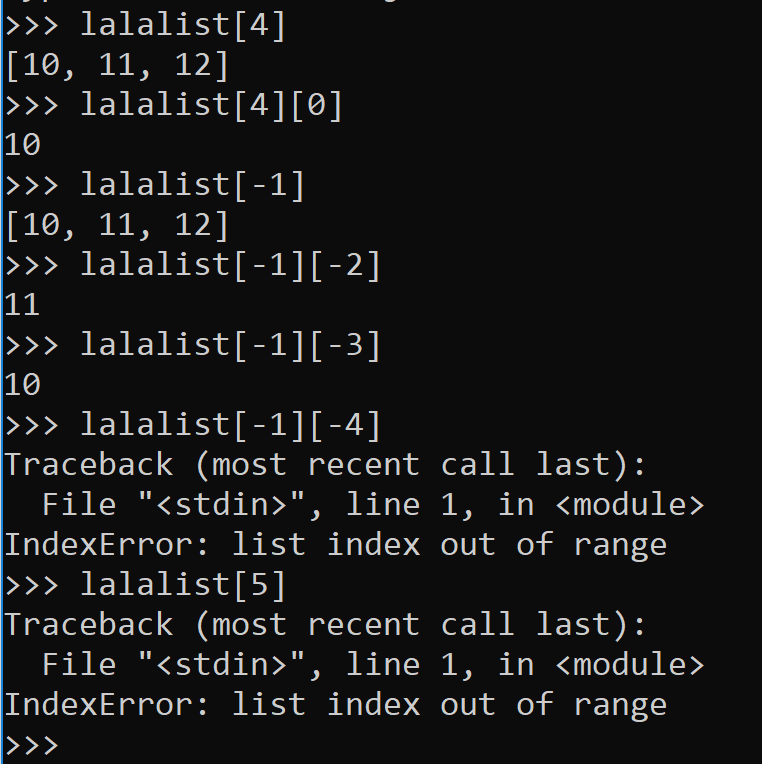
Learn to love this IndexError like it’s your bff.
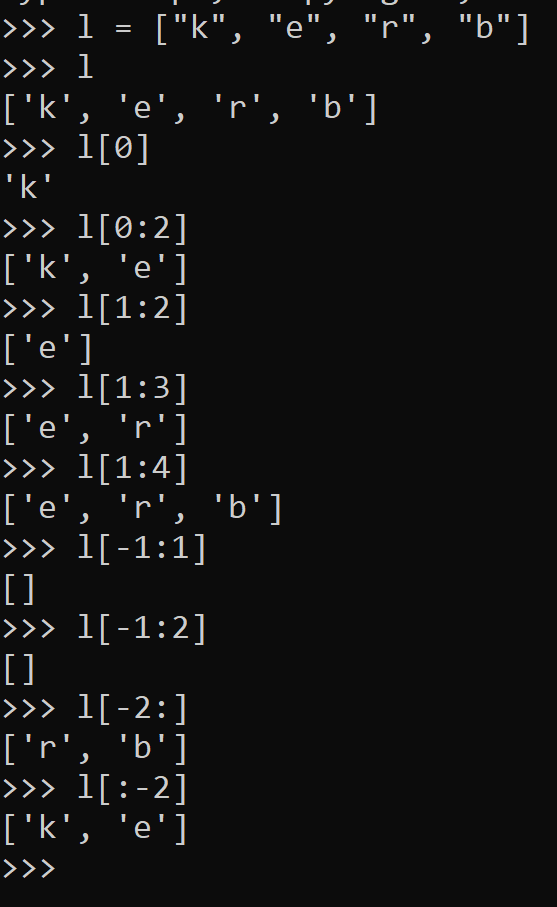
You can index elements in a list, starting from 0 and ending in -1 (see right).
If you want more than one element from your list, you can slice the list with a colon :, the beginning index, and the ending index less 1.
I wish they either used the beginning index and the ending index or the beginning index – 1 and the ending index – 1 but I’m sure they have their reasons. By the way, this is referred to as inclusive or exclusive. What’s that?
Consider [1:3) versus (4:7] versus (5:9) versus [2:8].
You may recall from mathematics that [1:3) is inclusive of 1 but exclusive of 3. (4:7] excludes 4 but includes 7. Based off of that, what do you think (5:9) or [2:8] mean?
Anyway, indexing a list is always done with brackets when you stick it into python, but mathematically, you can think of it like [beg:end). Conceptually, this is how to slice.
Just note that if you fail to always use the square brackets [] with lists in python, the compiler will yell. Parenthesis () are saved for tuples… but that is coming later!
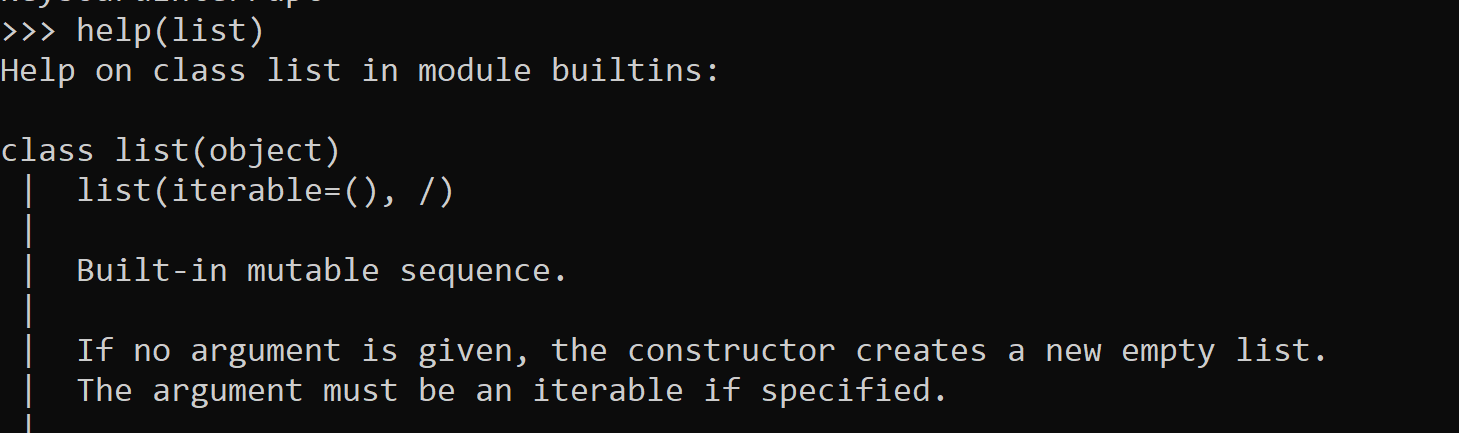
Slicing can be useless if your list isn’t sorted the way in needs to be. Yet, you can easily sort alphabetically or numerically using the sort method. Lists have lots of other fun toys, too. Every built-in method available and how to use them (i.e. the correct syntax) can be found using the python helpmethod (DON’T think about this too hard). Content from help comes from the author’s documentation. So if you ever write your own object… be sure to document it such that any newbie of the street can use it.
Other packages such as itertools have some great supplemental materials for python’s built-ins as well. Itertools essentially helps to avoid writing for loops, which can get ugly.
Simply type help(<class name>) to get all the juicy info about any object
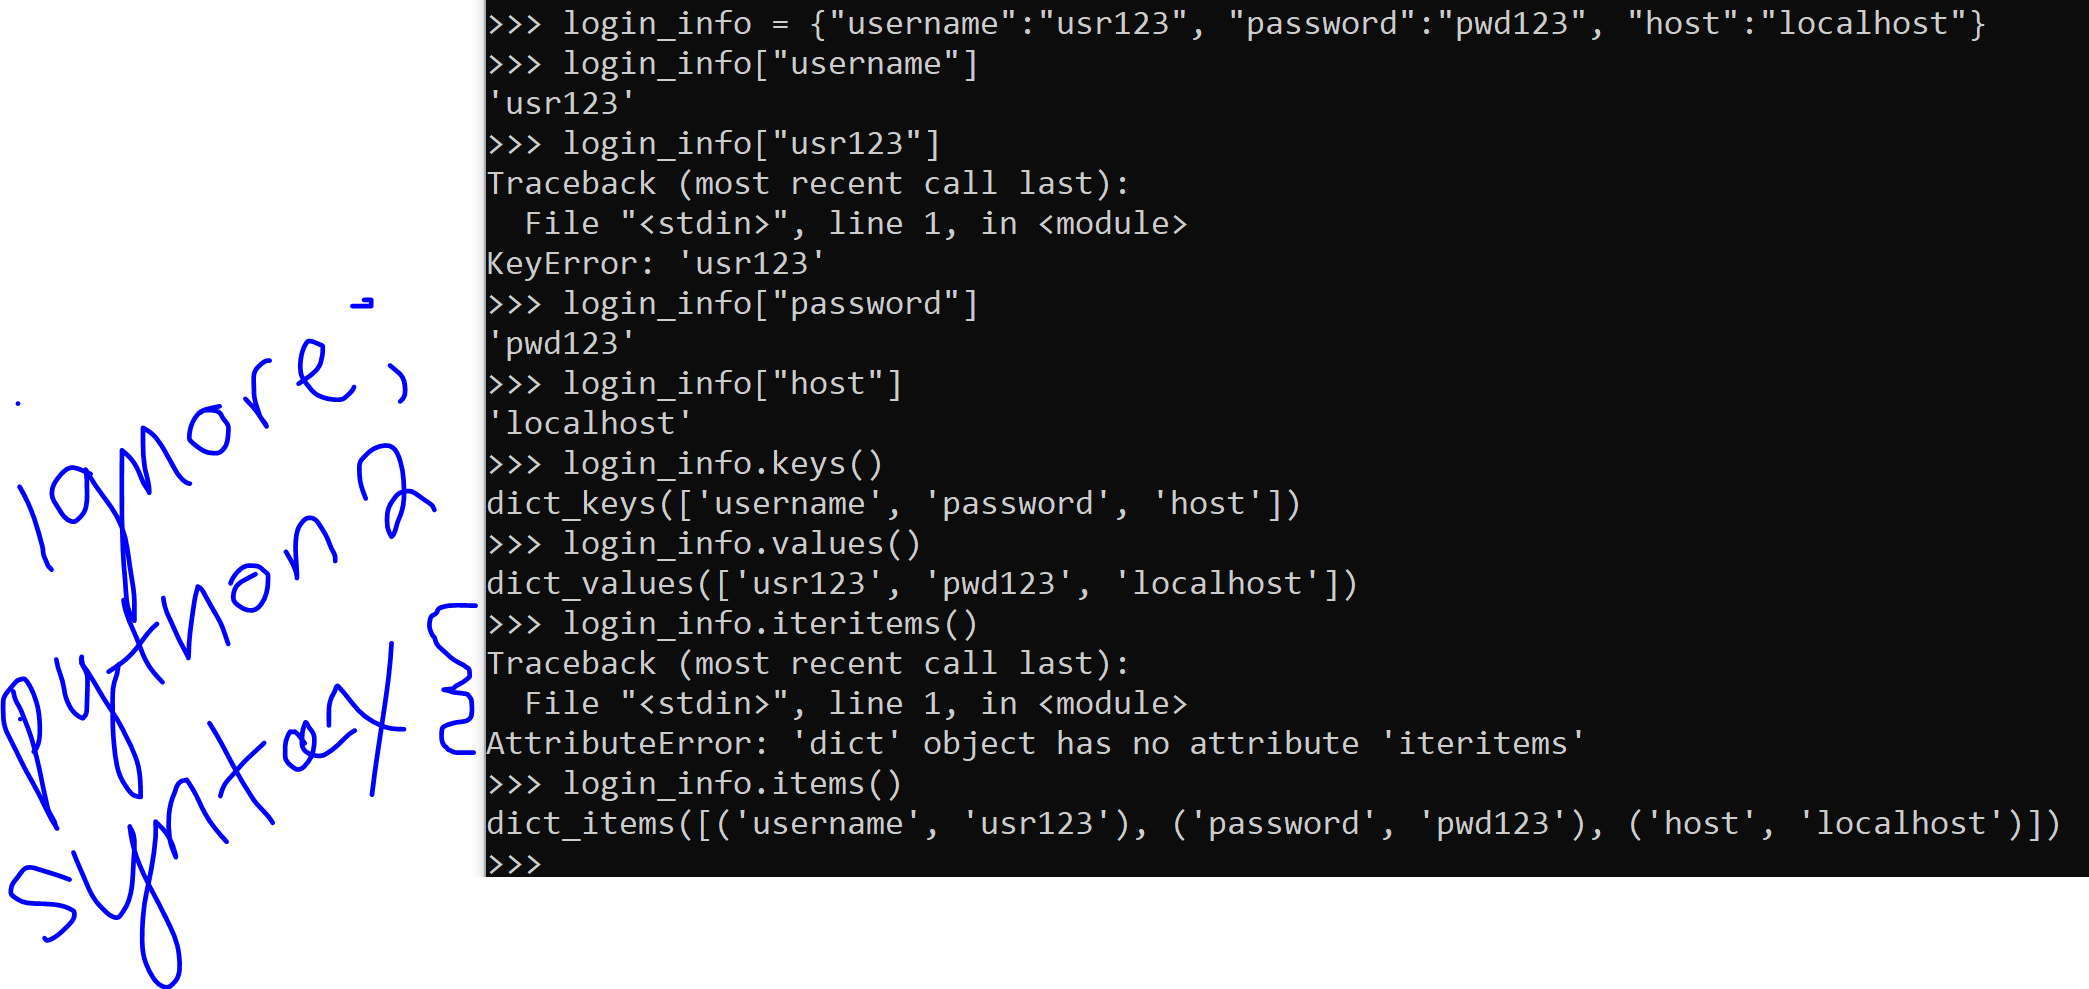
While you can index or slice a list, you may want to be fancier with how you label and call the elements in a collection. For example, instead of labeling an element as a generic 0, 1, or -5, you may want to call it by something more specific, like “First Names”, “password”, or “Zip Codes”. That’s where dictionaries can help you.
Dictionaries
Dictionaries are my favorite. The pandas dataframe came along and made everything all “user-friendly” but the collection known as the dictionary will always be my favorite.
Other languages may call the pythonic dictionary a map. Or a mapping. A key-value match. KV match map. You map the key to the value. It’s all pretty much the same.
Dictionaries (and maps) have key-value pairs. The keys are unique. The values each belong to their respective keys. Both key and value can be any datatype in python.
When learning new things, I often think of what the name of the thing means in English. The word dictionary to me is a big book with words in it that have respective definitions. The word is the key and the definition is the value. Could be why they called it a dictionary. Personally I think that makes more sense than a map. Like, this is a map:
Note: this is probably outdated
To each his own. As we’ve discussed, a name is just a name. It’s about what is truly beneath the name (albeit logical names do help).
Remember when we indexed the list earlier? We had to know like, where the element was in the list in order to yoink it out. Dictionaries are by definition, unordered. You couldn’t index by it’s position if you tried. But indexing by position is for lists (and tuples)! You “index” your value(s) out of the dictionary by it’s key, rather than position.
Note: some things in python 2 (versus 3, which I use) are slightly different
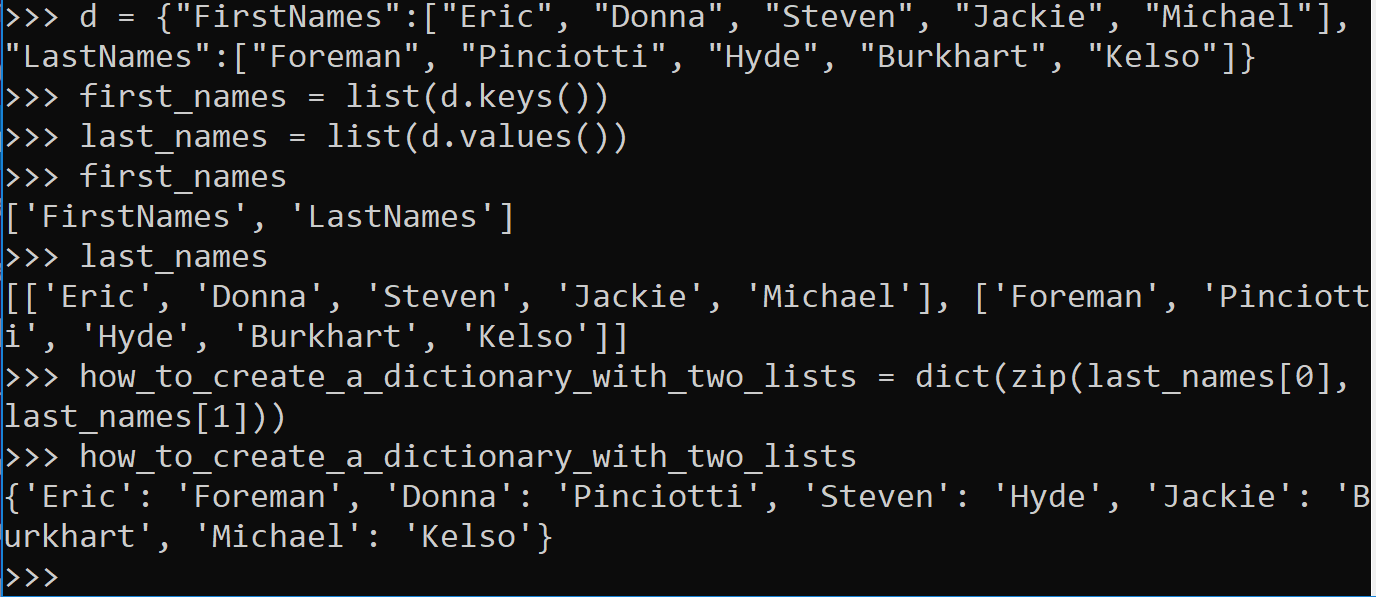
Cool, right? Dictionaries are also useful when multiple values belong to a single key.
some fun tricks you will probably use if you ever work with dictionaries
Tuples and Sets
Python also has tuples and sets.
Tuples are immutable. The word “mutable” is similar to the word “mutate,” which indicates a change has happened. So tuples can’t be changed.
This is different from lists and dictionaries. It is essentially the only difference between a tuple and a list.
You may want your collection to be immutable. You may not. This is what helps you make the decision between a list and a tuple.
Tuples use parenthesis () instead of the square brackets [].
I’m sure sets are useful but I’ve never used them in my life. They don’t allow duplicates, that’s what makes them special. The set uses both brackets and parenthesis ([]).
They’re also mutable. You can change them. As long as you don’t attempt to change an element to an element that already exists. I’ve never tried that. Could be interesting.
I will not judge a programmer for being unable to use the VIM.
I will judge a “programmer” for not knowing basic data types and data structures.
Way back before computers roamed the Earth — I’m talking dinosaur times — humans couldn’t just order groceries from Alexa for delivery straight into the pantry. Consider a village of vegan dinosaur-timers. All spring and summer they would gather nuts & berries, collecting them into baskets, stocking up while they could. They had to store their food somewhere, because no storage, no food during winter. Think about it.
It’s the same with data. No data structures, no memory for data. No food during winter. Everything would be just-in-time and data would never be stored. Or very disorganized.
We want to store our data, and to do it efficiently, which is another way of saying organized. So let’s begin.
From now on, pretend there are only 2 types of ways of describing anything in this world:
Numerical
Not numerical.
For example, in statistics, you have two types of variables: continuous and discrete. Numerical and categorical. Whatever you want to call it. I call it this:
Numbers
Not numbers.
This post will touch numerical data types in python. Let’s start with Examples.
Numbers can be 0, 1, 2, 3 . . . 106, 107, 108 . . . up to the biggest number you feel like thinking about. Infinity, if you want to call it that.
For the second one. I do like the word categorical here. Boy or girl. Black or white. Yes or no. True or false. Did buy the thing we marketed for; did notbuy the thing we marketed for. For those of you feeling binary, 0 or 1.
Naturally, one can have more than 2 categories. I’m a fan of maybe. Gray. And there is always something like, No ideaif they bought the thing we marketed for. Trinary is one of those situations where you subtract bi from nary and add a tri and it’s still a real thing: 0, 1, or 2.
Indeed, pretend these are the only adjectives you know: numerical, and not numerical. If you’re thinking of exceptions to the numbers vs. not numbers rule, kindly forget these exceptions. For in python, you have numericals, and not numericals. Quick think of something numerical.
Now type it into python.
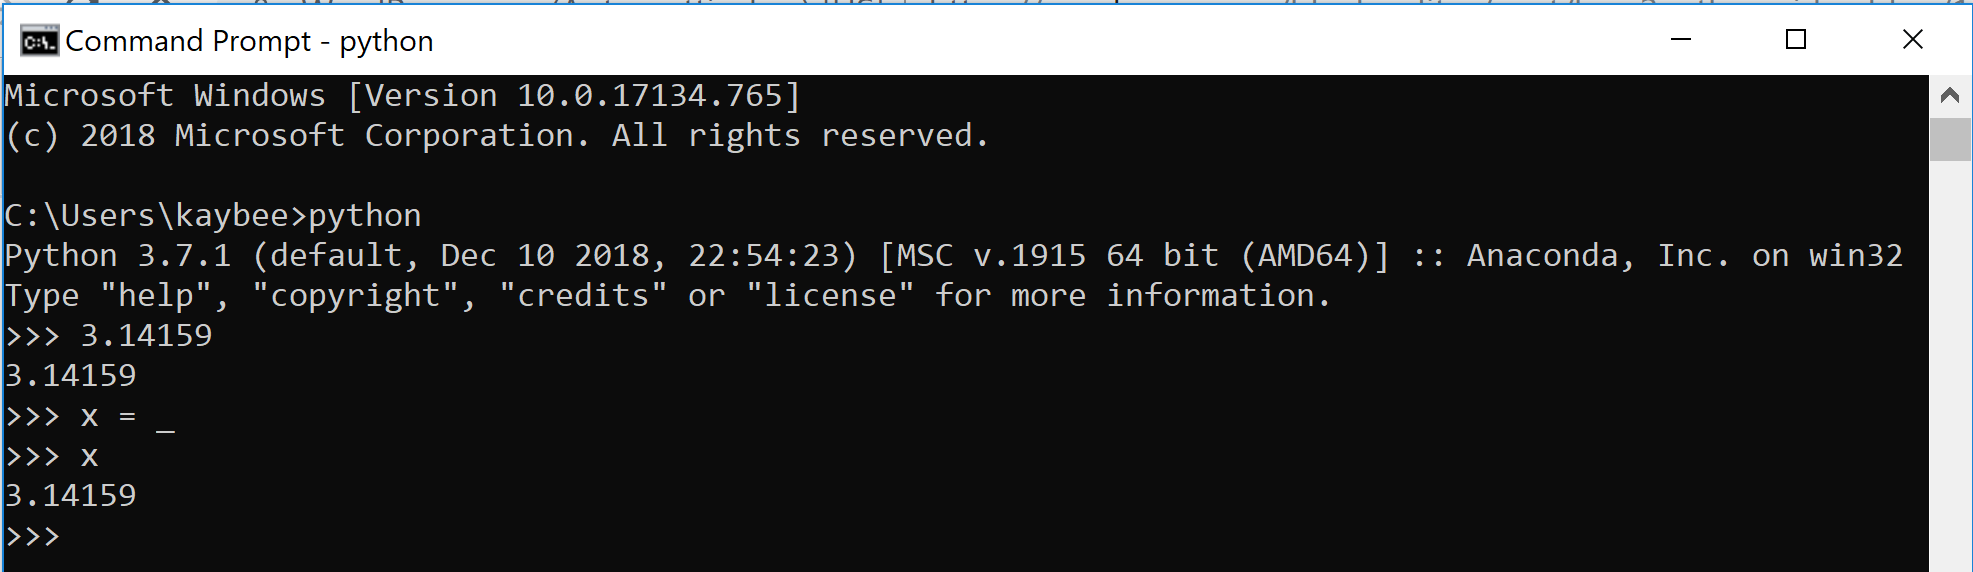
We’re going to get weird now. Say out loud the following sentence, “I’m going to assign this value I just printed out to a variable called, ‘x’.”
The sentence you just said is what is going on below. Proof? See for yourself.
“I’m going to assign this value I just printed out to a variable called, ‘x’.”
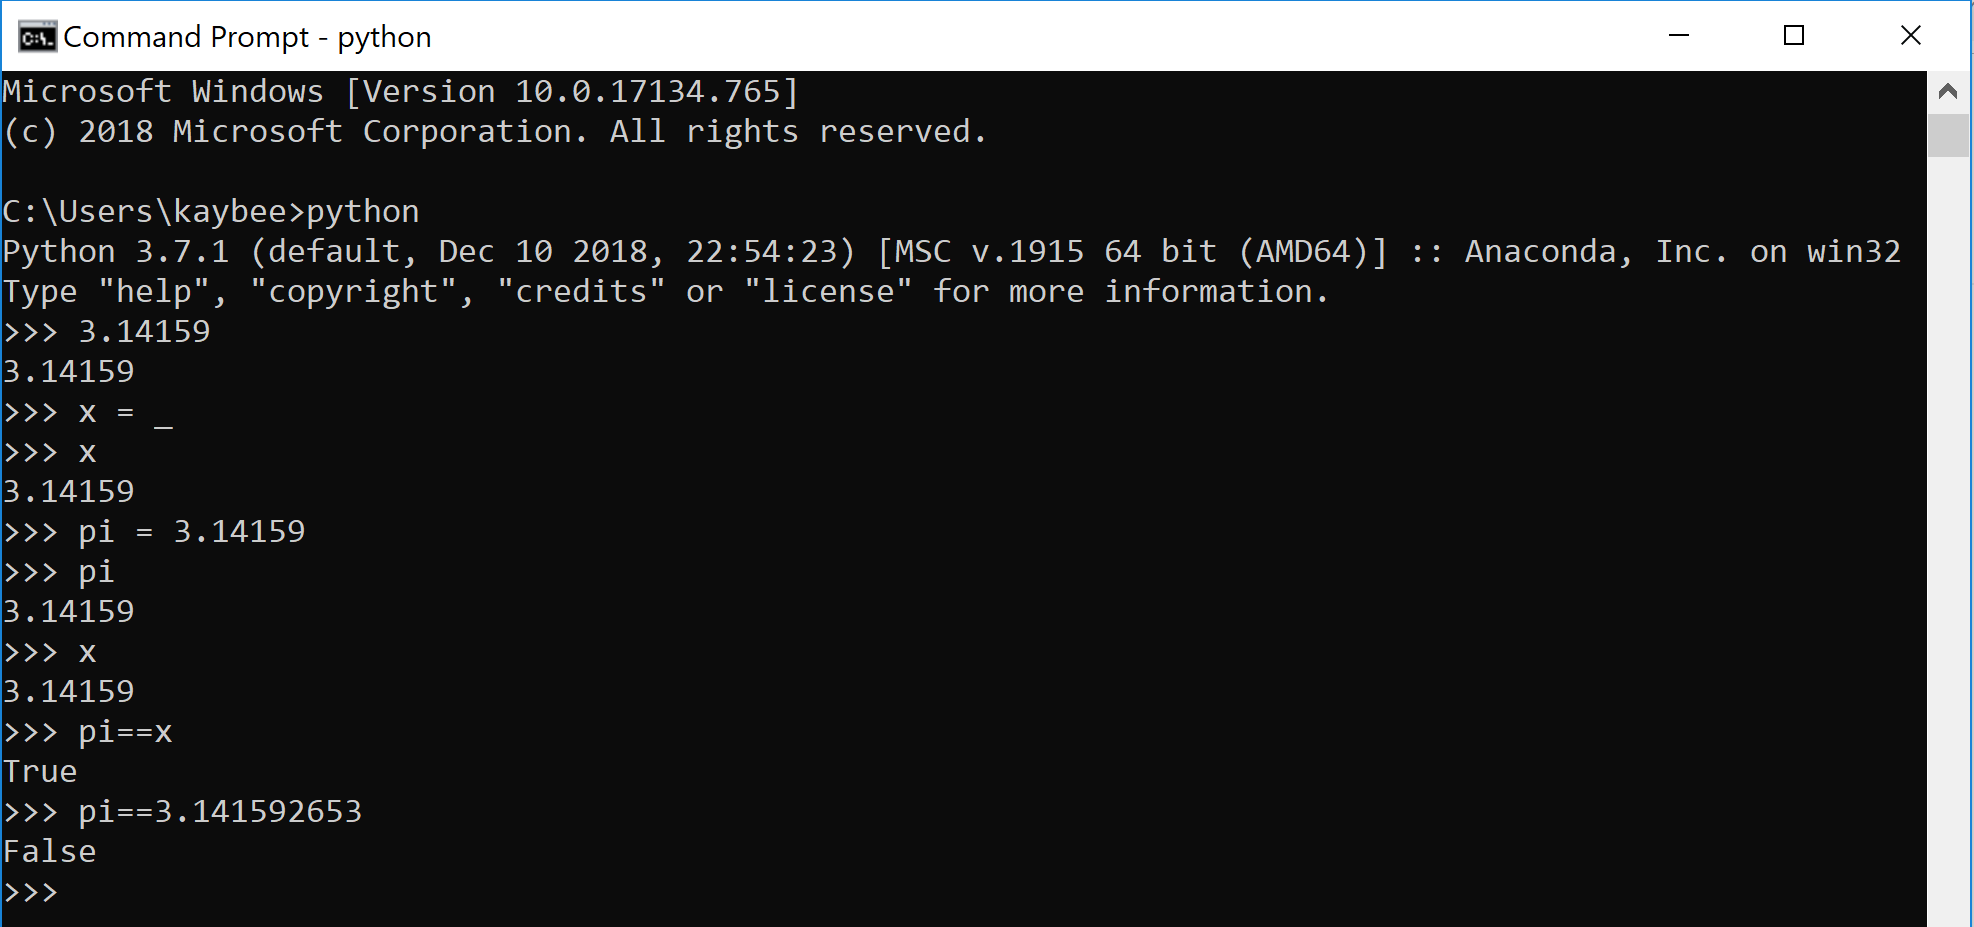
The simple and ambiguous x is actually a horrible variable name. Perhaps pi might be a better name. Or would it? Let’s ponder that, thinking in Python.
Always be weary of what is what, regardless of the name. Variable names can lie. Always think of what the value is beneath the variable.
In practice, unless you had potentially multiple variables containing pi but all with a differing number of digits, pi is probably fine as a name for either, despite pi being technically neither 3.1459 or 3.141592653.
Variable name selection is definitely important, but don’t overthink it. Let’s move on.
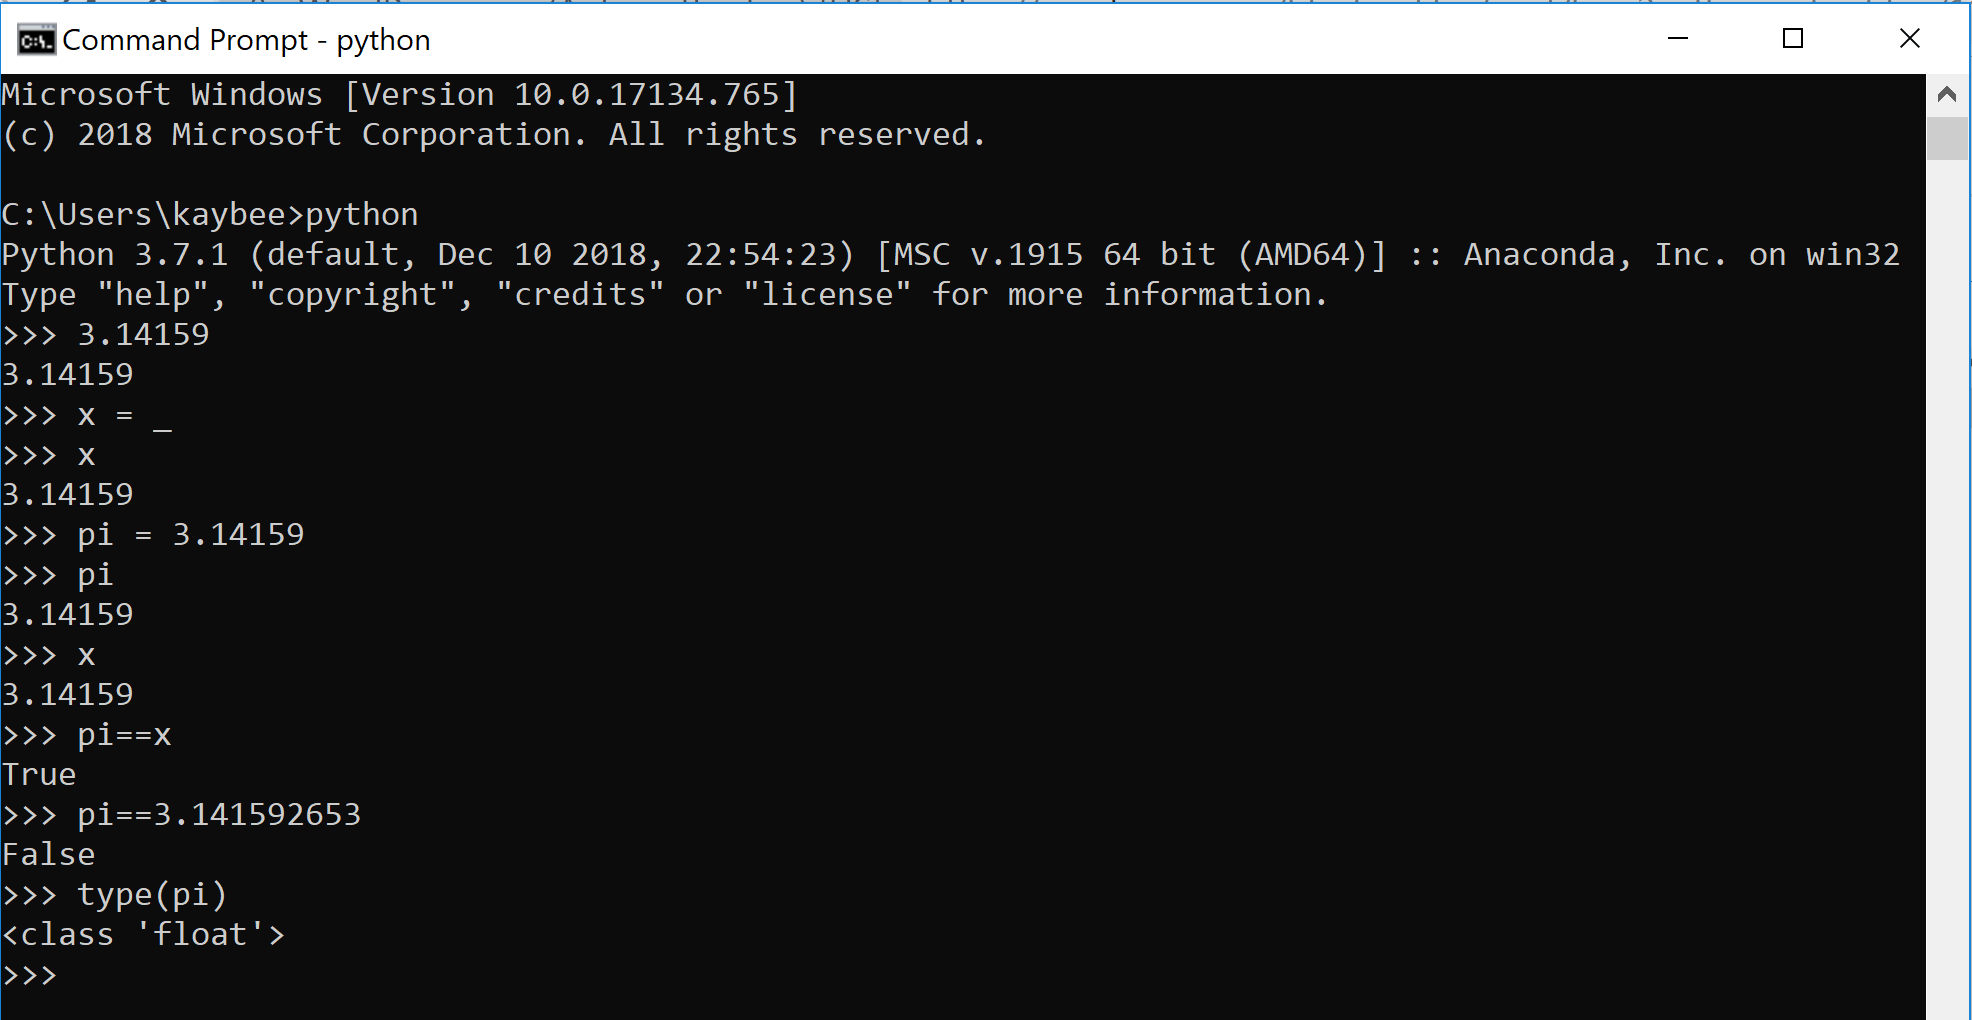
Python was not the first programming language ever written. It learned from the mistakes and shortcomings of others. Thus, it has this magical keyword: type
First of all, python understands how to assign types to stuff. It decides what type something is when we create it, not the other way around. Because of this, the type keyword is super useful when you’re deep in the forest and not sure where you are.
Take another look at the output for >>> type(pi). Float. Float? Like on a river?
“I floated into the abyss where there are infinitely many floats between any 2 integers.”
Naturally, python has rules for its typecasting. The variable pi, with the value 3.14159, is a float because it has a decimal point.
That’s all.
Try out any whole number and it will say (correctly) that it is an integer.
Float has a decimal point. Integer does not.
We now know 2 (numerical) python data types:
Integer (numerical) — whole number
Float (numerical) — has a decimal point
There’s also complex numbers in python. You can find out more about those in python’s excellent documentation. Personally, I have never used these. I’m more of a complex non-number.
To learn how2VIM, you need practice, time, patience, and other things no one has.
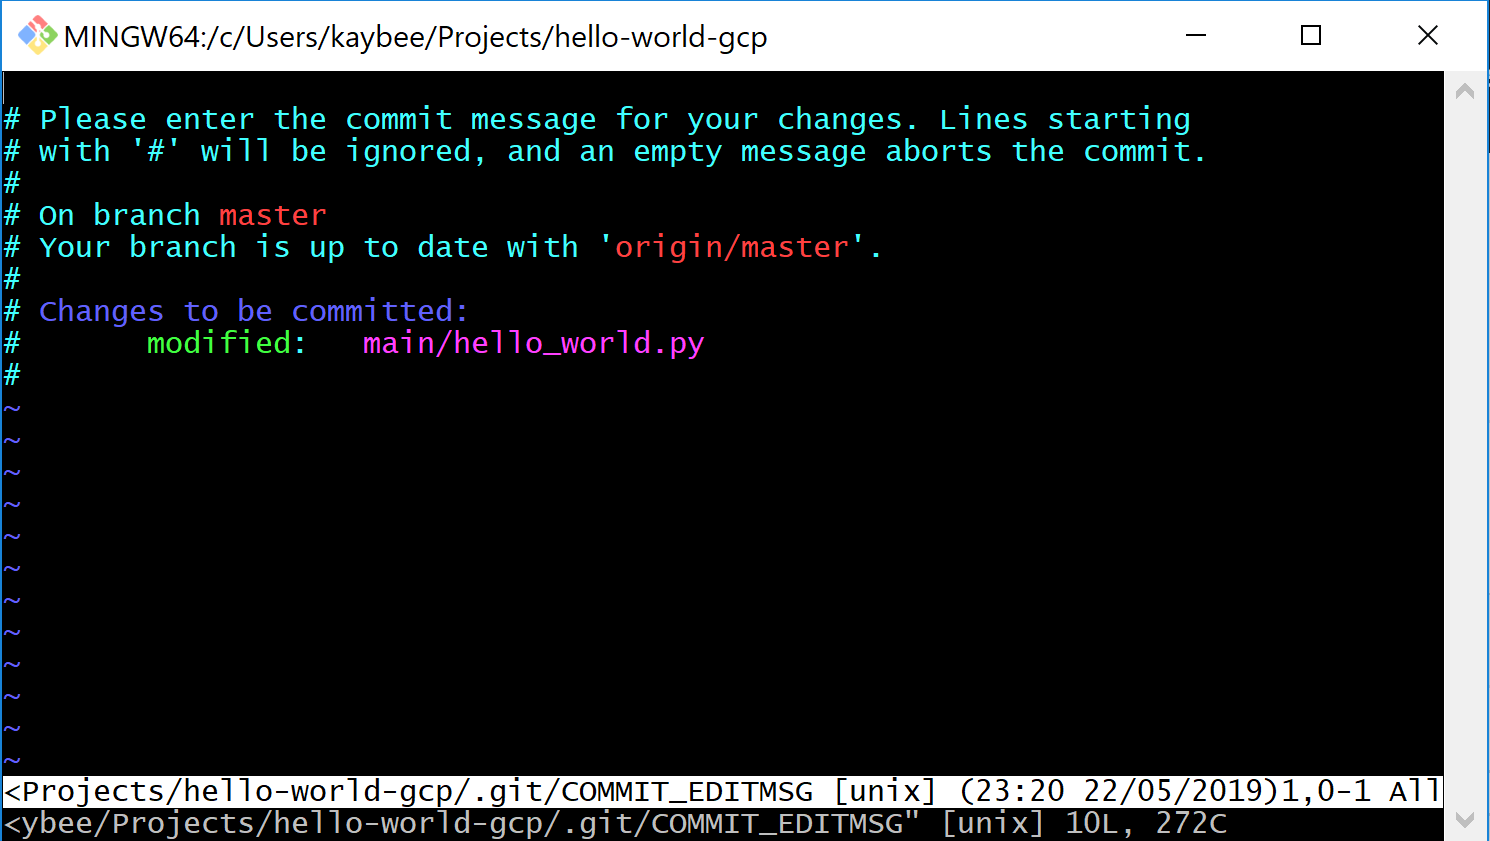
But: if you only use the VIM when git makes you solve a merge conflict or if you forgot the -m after your git commit and just entering this thing makes you uneasy, fear not.
aaaaAAAAAGGGHHHH
This is all you need to know about the VIM:
i for insert mode (no, don’t hit enter after)
esc for exiting (or escaping, and escaping fast) insert mode
if you write stuff and want to save your changes, watch the screen and type :w! (if you don’t see it typing, you might need to hit esc)
if you write stuff and don’t care about your changes, :q! for quit
if you want to write and quit in a single step, :wq!
How I might open a python file that lives on the Desktop, with the VIM