I was going to do a post on Cloud Computing with python but both Amazon and Google are sending me emails about free trials ending and credit cards expiring so that will wait.
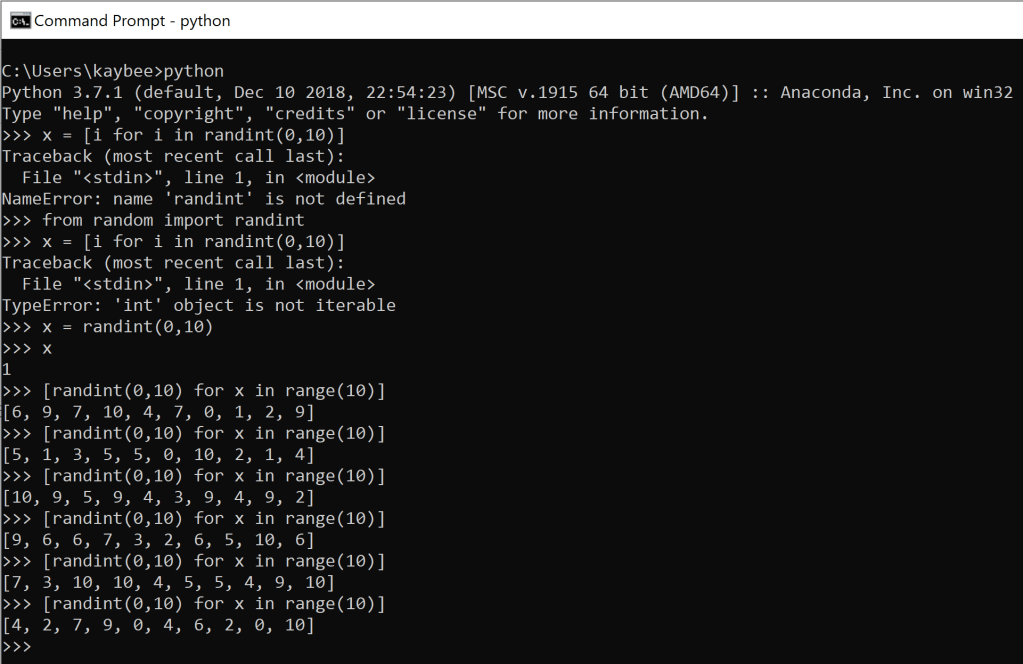
What you see above is a few attempts made in a Windows command prompt running python to spawn randomness. The randomness comes in instances of a list, generated by a list comprehension, of 10 numbers (denoted by range(10)) that are between the parameters of the random package’s randint, 0 and 10, inclusive of either.
The reason you see the same thing so many times is because I was pretty surprised that I got it to work so quickly, so I kept hitting enter to double check it was working properly. It was! They all came out with different numbers, exhibiting evidence of randomness. As a happy result, I had a little sampling distribution. So I decided to go a step further and auto-generate that too with arbitrary numbers.
List comprehensions are like the invention of self-cleaning ovens. Elevators. Zippers. Initially, they’re relatively challenging alternatives to slightly more otherwise laborious albeit easier-to-understand work; once you have them down the easier alternative really isn’t all that much easier.
How to Make a List Comprehension:
- Since you are producing a list, you start with brackets, like any other list
[] - If you feel totally lost, just write
[x for x in range(10)] - See what the above results are
- Change your list comprehension slightly by trying out something like
[x**2 for x in range(10)] - Familiarize yourself with the syntax…
[expression_using_thing_as_abstract_variable for thing in some_range_or_other_existing_list] - Experiment & keep practicing
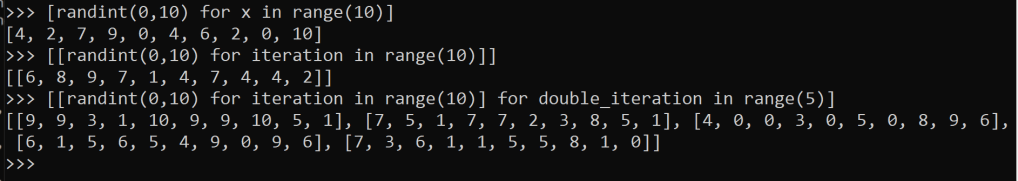
Notice how the expression_using_thing_as_abstract_variable part can be another list comprehension. The some_range_or_other_existing_list can also be another list comprehension. I do not recommend double list comprehensions until you feel comfortable with the basics, but I also won’t tell you how to live your life. For more information on the basics, python as always has excellent documentation.
Okay: say you just moved into a new place. Great new spot. Lovely amenities, nice neighbors.
Unfortunately your commute is a whole 7 minutes longer than it was from the old place. 7 minutes! Imagine what you could do with that time.
Obviously you can’t just claim your commute is 10 minutes (to round up, because life’s a drag) longer after 1 day. What time did you leave? What was the weather like? Was there a baseball game the night before (if you live in Chicago you know why this is relevant)? What day of the week was it? Etc.
Just like Kanye says you are not your mistakes, a single day does not represent all the days. You need a bigger sample size.
So how many days do we need to sample in order to represent all the days? Depends on who you ask. Depends on the data, the industry. The Central Limit Theorem (usually) says 30 is a sufficiently large sample size to obtain normally distributed data, such that our sample mean x̅ (or “xbar”) is approximately our population mean μ (or “mew”, the Greek letter for m, for mean). It also tells us that the larger the sample size, the better approximation we have; the bigger the count of observations, the closer we will be to the true mean.
But there’s still bias because Mondays are different from Fridays in terms of commute times. Everyone knows that! What if we recorded our excess morning commute time compared to the previous commute, every day, for 10 weeks? A sampling distribution.
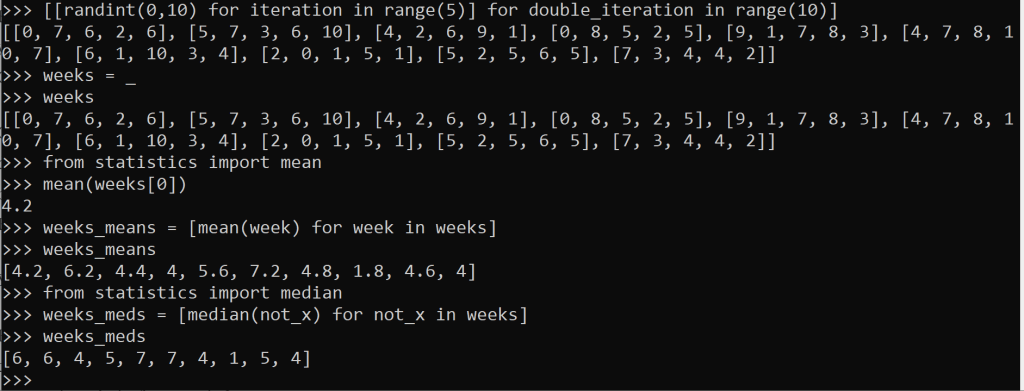
The data from that 10-week interval is generated above. I see some 0’s, which could mean our commute time was 0 minutes longer than the previous commute. Or does it? Maybe we worked from home. Maybe it was a holiday. We called in sick with a fever. Or, equally if not most likely, we were just living our life and forgot to record anything that day. Maybe the 0’s are really missing, or null values.
Maybe they’re some combination.
Listen: a good data set has these types of things explained in some metadata file sitting next to the data itself. The data has flaws. It will never not have flaws. If the data set claims to be perfect, you should certainly avoid that data set like the plague (unless you’re Arnau from La catedral del mar and you’re immune, then avoid it like Aledis).
There are a thousand python packages out there that are more user-friendly and formatted and also find the mean and median and whatever else you need. Pandas is the most popular, in conjunction with numpy and sklearn, even matplotlib if you like to graph stuff. In production code, these packages are probably essential.
During the experimentation phase especially, I like to keep it simple. The more fluff you have, the more room for bugs to hop on and hitch a ride. But we’ll go over how to use pandas next (and eventually, Cloud Computing… and Algebraic Data Types).
